ProcessApps
In the ProcessApp overview, you can find all your organization’s processes that are relevant (to you) as ProcessApps. They can be grouped by departments, teams, or other structures using ProcessApp Collections. ProcessApp Administrators have a list of all available ProcessApp Collections in the administration and can edit the Collections as well as create new ones.
Where are all available ProcessApps displayed?
Go to the ProcessApps from the menu.
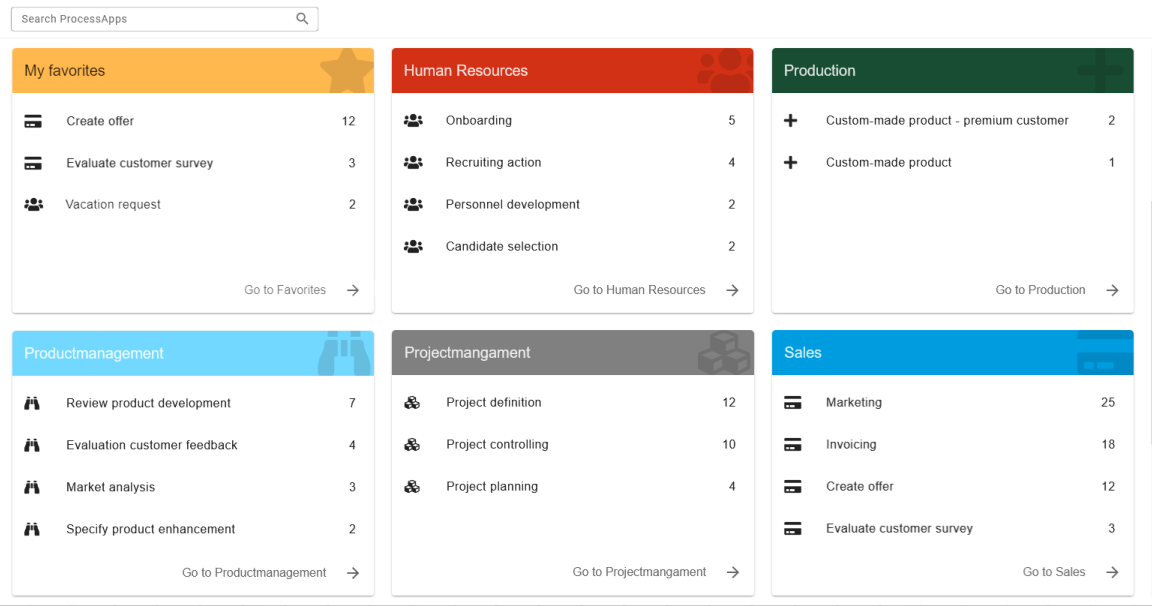
Depending on the configuration, this area may vary. However, you will find all executable, published processes (BPMN and EPC) of your tenant, displayed as ProcessApps.
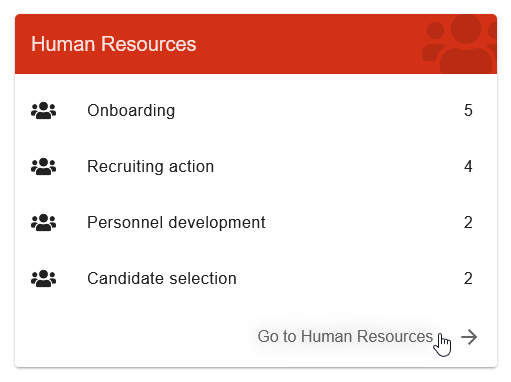
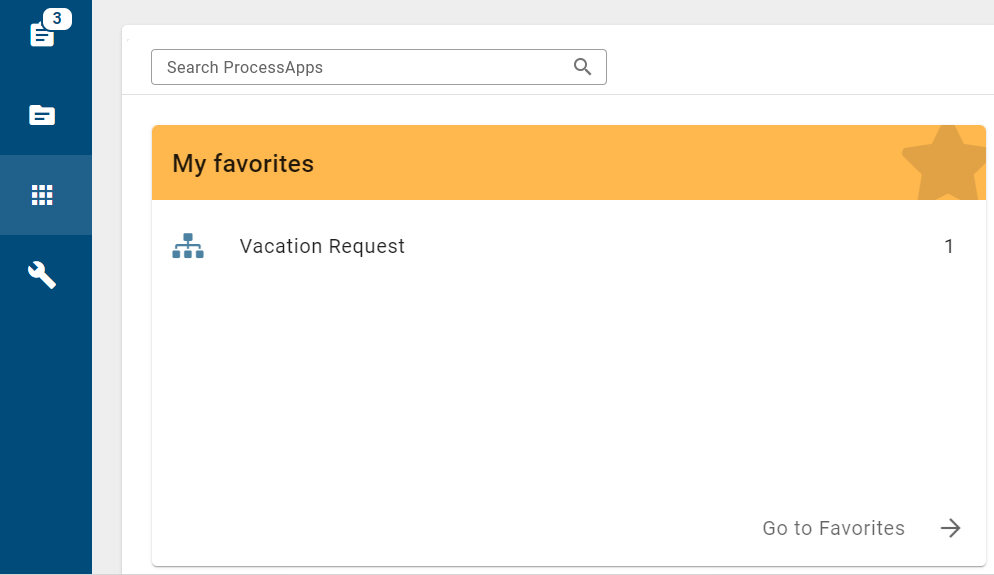
If ProcessApp Collections are defined in your tenant, you will see the ProcessApps grouped into these Collections. Collections are arranged alphabetically from left to right and top to bottom. Depending on your device and zoom factor, they are displayed in a single-column or multi-column list. The first Collection in the upper left corner is always the My favorites tile.
Note
Please note that a ProcessApp Collection only appears in this area if it has at least one ProcessApp assigned to it. Therefore, not all Collections created in the administration may be included here.
If you have ProcessApps that are not grouped into a ProcessApp Collection, you will see a Collection called More ProcessApps as the last Collection in the main area.
As a preview, the assigned ProcessApps with the highest number of running cases are displayed for each Collection. This allows you to access frequently used ProcessApps more quickly. If you select a ProcessApp in the preview, you will be navigated to the list of all running cases for that process.
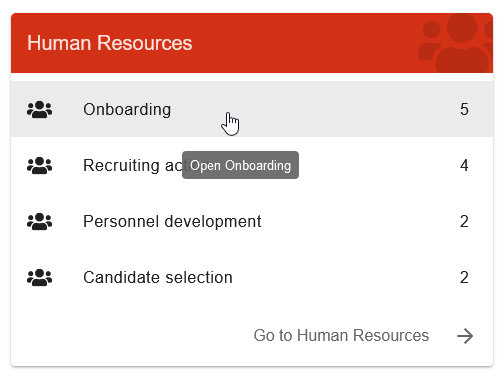
If you select the header of a ProcessApp Collection or the Go to button at a ProcessApp Collection, you will see a list of all ProcessApps of that Collection.
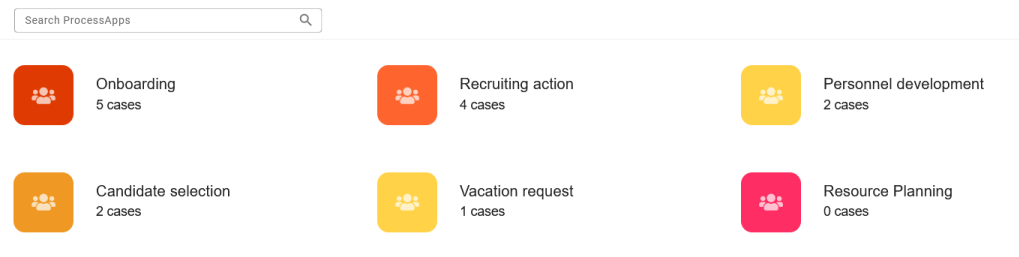
Each ProcessApp is represented by an icon and the name of the process in the selected content language. The ProcessApps are displayed in a multi-column list that varies depending on your device and zoom factor. Next to the icon and the name, you will see the number of running cases in which you are involved.
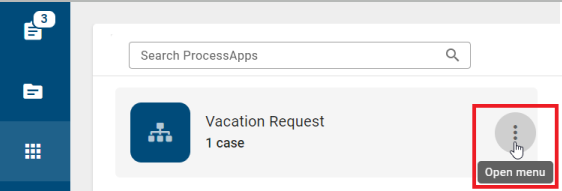
Selecting the ProcessApp itself will take you to the list of current cases for the process. When you hover over a ProcessApp, the context menu (three dots) appears at the entry. You can open the context menu by selecting the three dots once.

The menu (usually) contains three options for the respective process. The first option allows you to (un)mark the process as a favorite. The second option allows you to navigate to the corresponding diagram in GBTEC Process Design. Finally, if no case creation restriction is defined for the corresponding ProcessApp, you will find the option to create a new case for the process.
If no ProcessApp Collections have been configured, the ProcessApps area directly displays a multi-column list of all ProcessApps. For each ProcessApp, you have the same options as described above.
Note
Users with the ProcessApp Administrator user role have access to all running cases, even if they are not involved in those cases.
Users with the ProcessApp Creator role or higher can switch environments to view the processes of executable but still unpublished diagrams.
Tip
You can configure each process icon individually. You can also search for specific processes or add them as favorites to your favorites list for quick access.
How can I search for a specific ProcessApp?
Within the ProcessApps area, you can search for specific processes. To do so, use the search field in GBTEC Work Orchestrator while you are in the ProcessApps area. Enter the term you want to search for. The search is started as soon as you click on the magnifying glass icon or press Enter. The result will be all ProcessApps that contain the term in the selected content language. The search results are not grouped into ProcessApp Collections.

If the name of a process has not been maintained, the corresponding ProcessApps are not displayed.
Note
The search is case-insensitive. The search does not support expressions such as wildcards.
How do I add a ProcessApp to my favorites and view my favorites?
In GBTEC Work Orchestrator, you can mark individual ProcessApps as your favorites. They are marked with a star icon.

In the ProcessApp overview, these favorites will appear in the My favorites Collection.
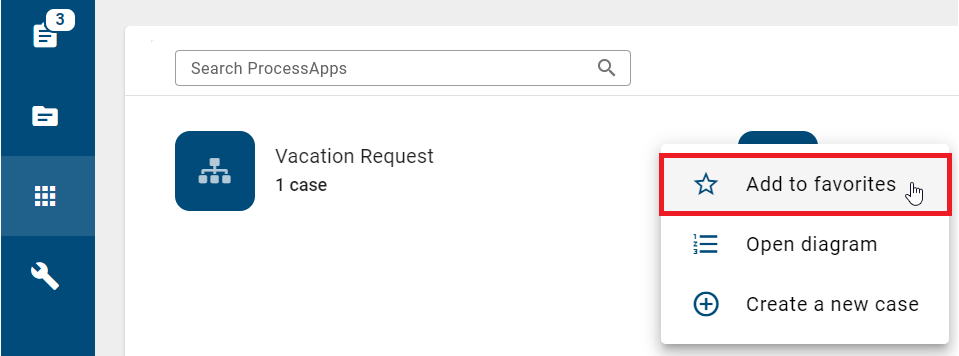
To add a ProcessApp to your favorites, go to the ProcessApps and navigate to the desired ProcessApp (possibly in a Collection first). Then use the three dots to open the menu of the ProcessApp.
When you select the Add to favorites function, the ProcessApp is displayed with a yellow star icon.
If you want to remove a ProcessApp from your favorites, you have to use the Remove from favorites function, which you will find in the menu of the ProcessApp.
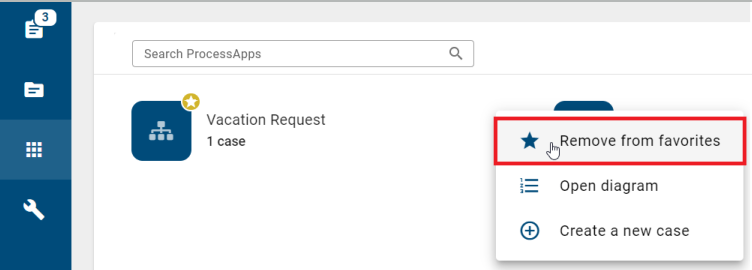
The star icon of the corresponding ProcessApp will disappear then.
How do I navigate from my ProcessApp to the corresponding diagram in GBTEC Process Design?
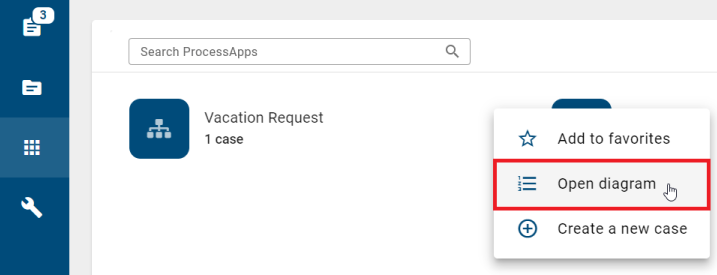
When you are in the ProcessApp overview and open the context menu of a specific ProcessApp, you will find the option to navigate to the corresponding diagram in GBTEC Process Design.
Selecting the Open diagram option will take you to the corresponding diagram. The diagram for that ProcessApp will open in a new browser tab and will automatically display the corresponding area of the process in GBTEC Process Design.
Hint
If a diagram with active cases has been depublished, you can still click on the option to view the diagram. Please note that it is now in the archived state.
How can I link published ProcessApps to a catalog object type and start cases?
To link a published ProcessApp to a catalog object type, you must be in GBTEC Process Design and have the Administrator user role. If you are currently in GBTEC Work Orchestrator, you can switch directly to GBTEC Process Design by using the Process Management focus in the focus drop-down menu in the header. In the left menu bar, go to the Administration menu item and select the Catalog tile. A list of all available object types will then be displayed.
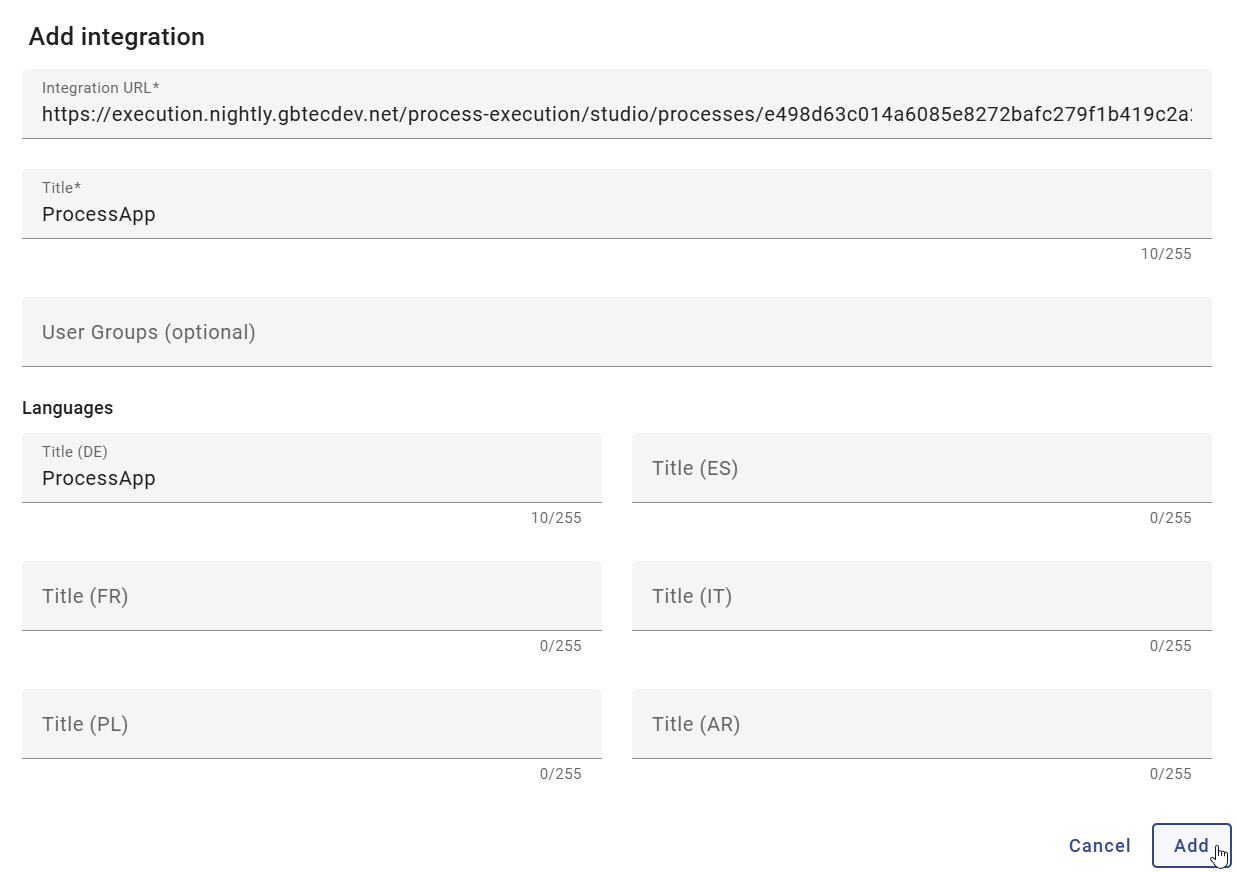
Click on the desired object type and switch to the Integrations tab. To link a published ProcessApp to this object type, click the Add integration button in the lower right corner. This opens a dialog where you must enter the run link for the published ProcessApp in the Integration URL input field and a name in the Title input field.
Warning
Please note that for a successful integration, the run link of the published ProcessApp must follow the format https://xxxx/process-execution/xxxx/processes/xxxx/run and must refer to an already published ProcessApp. For more information, see here.
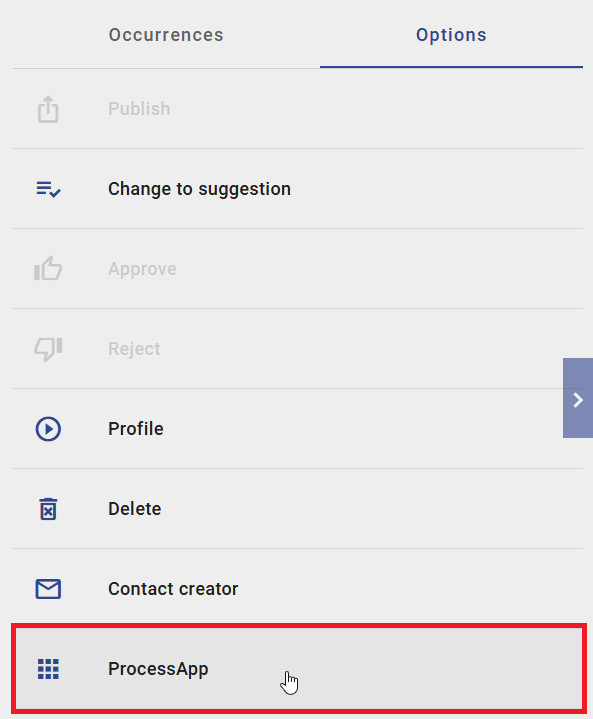
Save the integration by clicking the Add button. Then go to the Catalog menu item in the left menu bar. In the right sidebar, in the Filter panel, filter by the object type for which you created the integration. Select an entry from the list to open its details view. In the right sidebar, in the Options panel, the linked ProcessApp will now be displayed.
Hint
Please note that the use of integrations requires a separate license, which you must purchase.
Once a ProcessApp is linked to a catalog object type, all users with the ProcessApp Creator, ProcessApp Administrator or ProcessApp User role can start a case directly from the catalog. To do this, click the button with the name of the linked ProcessApp in the Options panel in the right sidebar of the catalog item for the corresponding object type. You will then be redirected to GBTEC Work Orchestrator, where a new case for the linked ProcessApp will be started.
How can I set a default case owner for a ProcessApp?
As a user with the ProcessApp Creator user role, you can set a default case owner for a ProcessApp. The default case owner can be either a single user or a user group.
To set the default case owner, you must be in GBTEC Process Design. If you are currently in GBTEC Work Orchestrator, switch to GBTEC Process Design in the header bar by using the Process Design focus in the focus drop-down menu.
Open the Diagrams menu item in the left menu bar. There you can create a new diagram or check out an existing diagram. Open a diagram that is marked as an executable process and check it out.
Then open the Details panel in the right sidebar and select the Automation attribute group. There you find the Case Owner input field above the Analyst input field. In this input field, you can set a user or a user group as the default case owner.
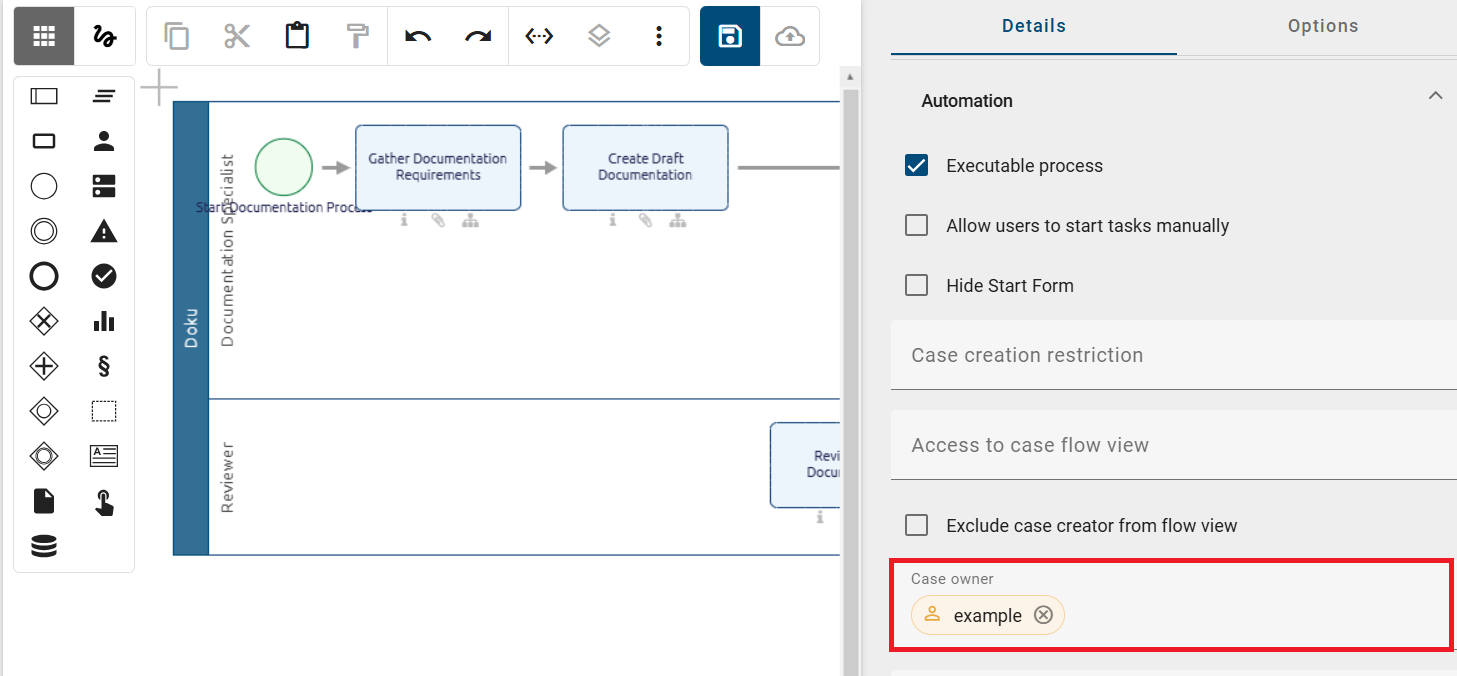
If a default case owner is set for a ProcessApp, this user or user group is automatically used for all new cases of this ProcessApp. The default case owner always overrides the case creator. This means that the set user or user group is entered as the case owner even if another user creates the case.
This setting applies to all cases, regardless of how they are created. This includes, for example:
cases that are started via the Test ProcessApp button
cases that are created via the Create button
cases that are created manually
cases that are created via the Public API
cases that are created via a run link
cases that are automatically triggered by a start event such as a timer
cases that are created by a call activity
How can I connect published ProcessApps to a diagram type and start cases?
To connect published ProcessApps to a diagram type, you must be working in GBTEC Process Design and have the user role Administrator. If you are currently in GBTEC Work Orchestrator, you can directly switch to GBTEC Process Design by using the Process Design focus in the focus drop-down menu in the header. In the left menu bar, select the menu item Administration and then click the Details tile. A list of all available diagram types is then displayed.
Select the desired diagram type and switch to the Integrations tab. To connect a published ProcessApp to this diagram type, click the Add integration button in the lower right corner of the screen. A dialog opens where you must enter the run link of the published ProcessApp in the Integration URL field and a name for the integration in the Title field.
Warning
Please note that for a successful integration, the run link of the published ProcessApp must follow the format https://xxxx/process-execution/xxxx/processes/xxxx/run and must refer to an already published ProcessApp. For more information, see here.
Save the integration using the Add button. Then switch to the menu item Diagrams in the left menu bar. After opening the diagram, you will find the connected ProcessApp in the Options panel in the right sidebar.
Hint
Please note that the use of integrations requires a separate license and must be purchased separately.
Once a ProcessApp is connected to a diagram type, all users with the roles ProcessApp Creator, ProcessApp Administrator, or ProcessApp User can start a case directly from the diagram. To do this, click the button with the name of the connected ProcessApp in the Options panel in the right sidebar of a diagram. You are then redirected to GBTEC Work Orchestrator, where a new case for the connected ProcessApp is started.
How can I add custom columns with my own variables to a ProcessApp?
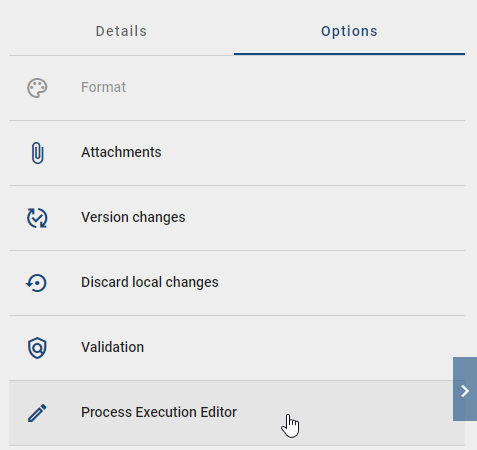
As a user with the ProcessApp Creator user role, you can define custom columns with your own variables for the processes within a ProcessApp. To do this, open a diagram in GBTEC Process Design, check it out, and click on an empty area of the canvas. In the Details panel in the right sidebar, select the Automation attribute group and mark the process as an executable process. Next, switch to the Options panel and select the Process Execution Editor option. Click the Open editor option and, in the ProcessApp Configuration that appears, switch to the Table Columns tab.
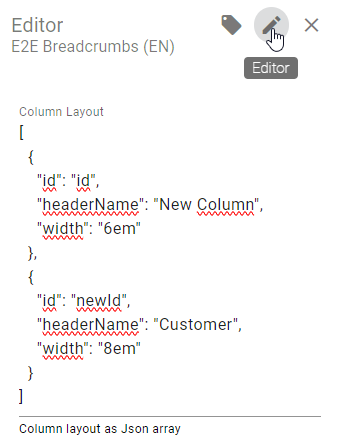
Here, you can define the layout for your custom columns. The layout must be entered as an array in JSON format and contain the following objects:
id: Here you need to enter the name of the variable to be used.
headerName: Here you need to enter the column name that should be displayed in the ProcessApp.
width: [Optional] Here you can enter the width of the column (e.g., 150px, 10em, 75%).
type: [Optional] Here you can enter the output type of the variable. Allowed types are text, string, date, datetime, time, and boolean. If no type is specified, the output will be string, number or boolean.
hide: [Optional] Here you have the option to hide a column (true/false).
Code to copy and test:
[
    {
        "id": "customer",
        "headerName": "Customer",
        "width": "6em"
    },
    {
        "id": "weight",
        "headerName": "Weight",
        "width": "8em"
    }
]
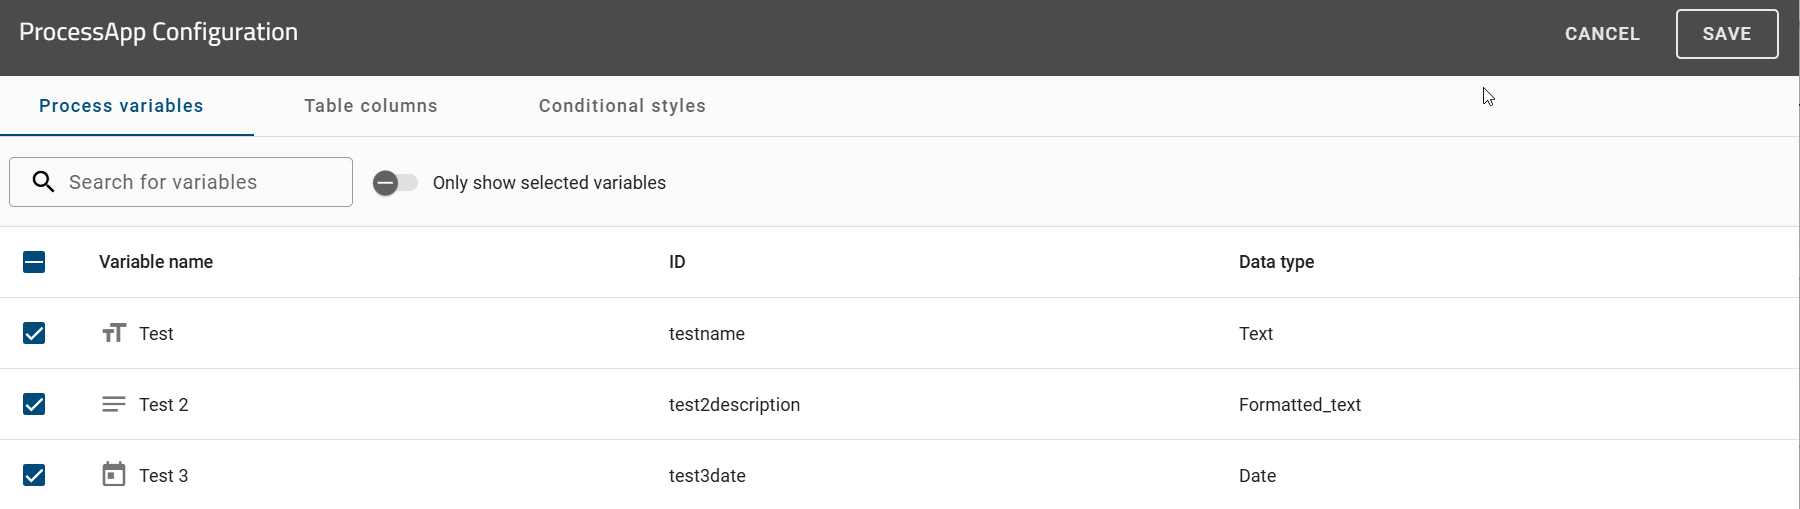
Alternatively, you can select available process variables in the Process Variables tab using the checkboxes to the left of the variable name to automatically generate the respective array in JSON format. As soon as you select at least one available process variable, the id and headerName objects are automatically inserted with the corresponding data in the Table Columns tab.
Note
Please note that when you select a Section, only the fields it contains will be automatically inserted with the corresponding data in the Table Columns tab. However, the Section itself will not be inserted.
To make it easier to search for specific available process variables, a search field is available in the Process Variables tab. You can use it to search for process variables by variable name or ID. You can view already selected process variables by clicking on the Only show selected variables button. If you want to select all available process variables, click the Select all button to the left of Variable name.
When an available process variable is deselected, the corresponding array is also removed in the Table Columns tab. Modified arrays of available process variables or manually added arrays always remain in place unless you remove them manually.
Hint
Please note that the corresponding checkbox is automatically activated when an array is added manually and matches the ID of an available process variable. This ensures that both views are synchronized.
After saving the changes made in the ProcessApp Configuration through the Save button, checking in the diagram and creating a case for this process, your custom columns and associated variables will now be displayed in the ProcessApp. The columns are displayed in the order in which you have defined them.

If the variable customer (taken from the example) in the id object contains multiple objects with different values, such as
customer = {
            "address": "addr",
            "email": "emailAddr"
           }
the custom column is not displayed. To display a custom column correctly for a variable with multiple objects, the individual object must be explicitly specified in the id object. For example, to display a customer’s email address from the customer variable in a custom column, customer.email must be specified in the id object.
You can also apply the headerName, width and hide objects to the default columns of a ProcessApp. This allows you to customize the name and width of the default column, or to hide the default column.
Note
The default columns are accessible via the _case object. To do this, enter the _case object in the id object. For example, you can access the Name default column through _case.name and edit the column name through the headerName object.
Example:
{
"id": "_case.name",
"headerName": "Name of Case",
"width": "10em"
}
The default column Name was renamed to Name of Case.
If a ProcessApp has configured columns, you have the option of filtering all cases of a process according to their respective case data. If user-defined columns are available for the process, these are displayed as new facets at the top of the filter area.
Hint
Please note that the facets displayed represent unique values for which no type or string type is defined.
How can I apply (conditional) formatting to a ProcessApp?
As a user with the ProcessApp Creator role, you can apply (conditional) formatting to a ProcessApp. This allows you to highlight rows or cells based on specific conditions. If you are currently in GBTEC Work Orchestrator, you can switch to GBTEC Process Design by using the Process Design focus in the focus drop-down menu in the header. Open a diagram, check it out, and click on an empty area of the canvas. In the Details panel in the right sidebar, select the Automation attribute group and mark the process as an executable process. Next, switch to the Options panel and select Process Execution Editor. Click the Open editor button. In the ProcessApp Configuration, switch to the Conditional styles tab.
In this tab, you define rules in JSON format. These rules control how rows or cells are displayed based on conditions.
expression: Here you must enter the condition to be evaluated.
style: Here you must enter the CSS style to be applied if the condition evaluates to TRUE.
target: Here you must specify whether the CSS style should be applied to the entire row or only to a specific cell.
columnId: [Optional] Here you can specify the column(s) to which to apply the style when it is applied to a cell. This can be a single column or an array of columns.
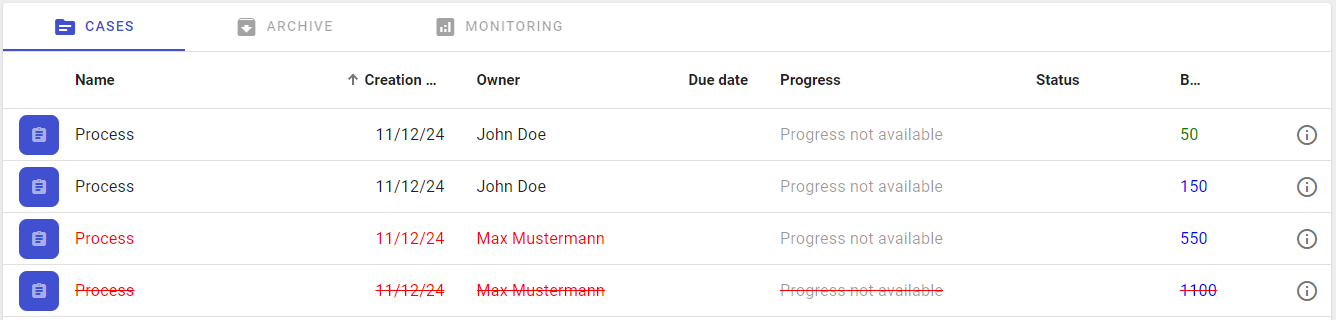
The following example adds a custom column named “Customer”. The style is applied when the value is “Max”.
Code to copy and test:
Table columns:
[
    {
        "id": "customer",
        "headerName": "Customer",
        "width": "6em"
    }
]

Conditional styles:
[
    {
        "expression": "contains(customer, 'Max')",
        "style": "color:red; font-family: courier; font-weight: bold; border: 2px solid powderblue;",
        "target": "cell",
        "columnId": "name"
    }
]
After saving your changes in the ProcessApp Configuration, checking in the diagram, and creating a case for this process, the formatting is applied automatically when the condition is met.
Note
You can also apply the (conditional) formatting to (individual) default columns. To do this, enter the corresponding _case object in the columnId object. For example, you can use _case.name to apply the (conditional) formatting to the default column Name.
Dashboard
As a ProcessApp Administrator, you can view a dashboard for each ProcessApp that provides you with information about the status of all running cases. You can switch to the Monitoring tab from the case list of a ProcessApp.

How can I monitor the status of all open cases for a ProcessApp?
When you open the Monitoring tab for a ProcessApp as a ProcessApp Administrator, you will see three tiles at the top showing the current status of all open cases in terms of number and percentage.

The tiles are divided into different categories to give you a better overview of open cases and to reduce the risk of falling behind. The three categories are:
Off track: Open cases that are already overdue.
At risk: Open cases that have at least one overdue active task and aren’t already off track.
On track: Open cases that are not overdue and have no overdue active task.
Clicking on one of these tiles opens the case list of the ProcessApp, filtered by the selected status. You can then set additional filters and adjust the case list according to your needs.
How can I monitor completed cases and the average processing time?
When you open the Monitoring tab for a ProcessApp as a ProcessApp Administrator, you will see a Case completion and average processing time tile with a summary of all completed cases and their average processing time as a bar chart.
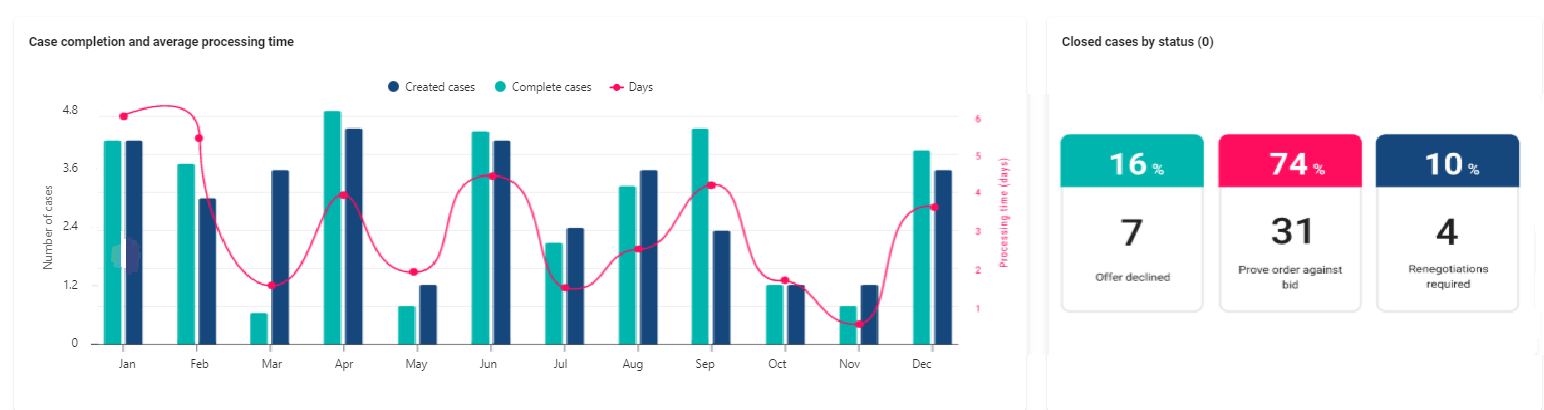
The bar chart shows the last 12 months, e.g. from January to December. The left y-axis shows the number of cases created (blue) and completed (green) per month, while the right y-axis shows the average performance of the completed cases. A line (pink) representing the average performance lies above the bars, highlighting the performance values for each month.
You can also hover over the pink line to view detailed information about cases and their average completion time. To hide specific details, click on the corresponding entry in the legend above the bar chart. Click the entry again to display the information.
You can also use this tile to view the case list of completed cases within a specific month. To do so, click on the corresponding Completed cases bar in the bar chart for the desired month. All of the completed cases from that month will then be displayed in a case list.
How can I monitor the status of the running cases for a ProcessApp?
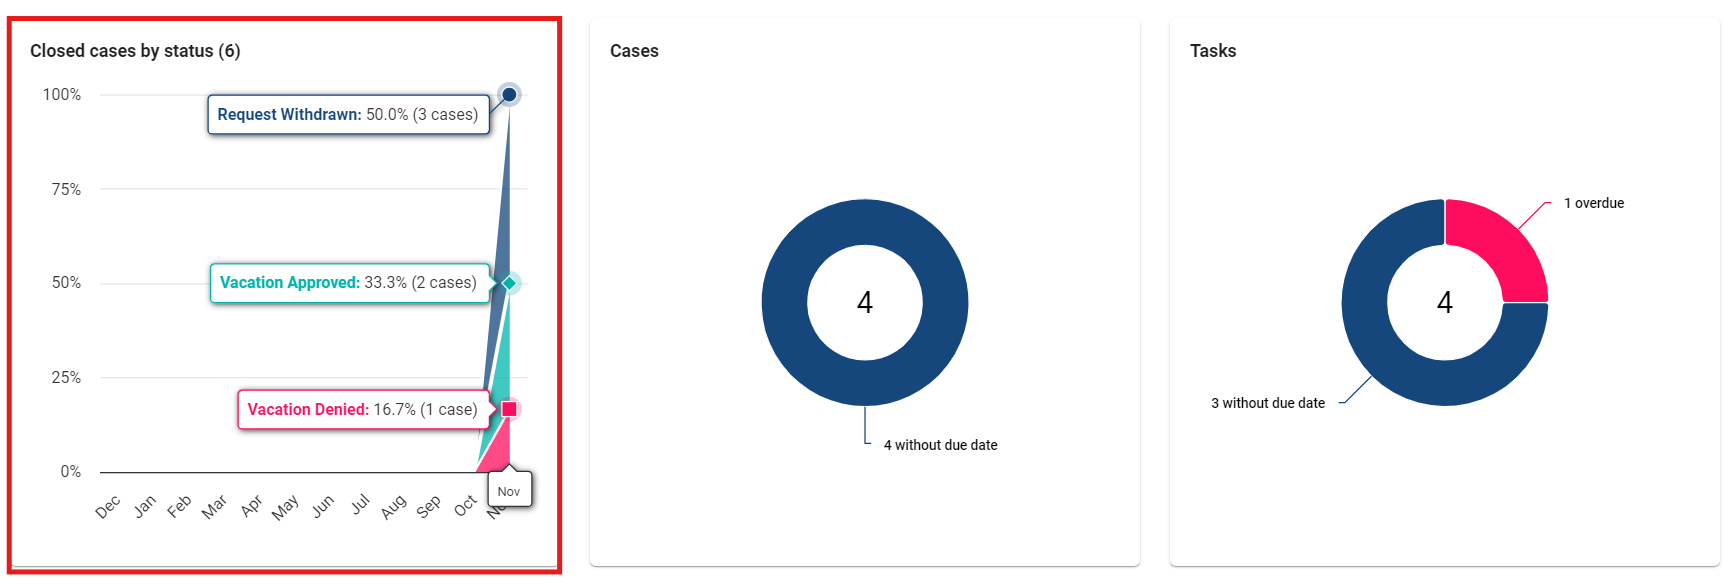
When you open the Monitoring tab for a ProcessApp as a ProcessApp Administrator, you will see a Cases tile with a summary of the status of the running cases in a donut chart:
(current) cases that are running on time, meaning the due date is in the future.
Cases without a due date
Overdue cases (according to the server’s time zone, UTC)
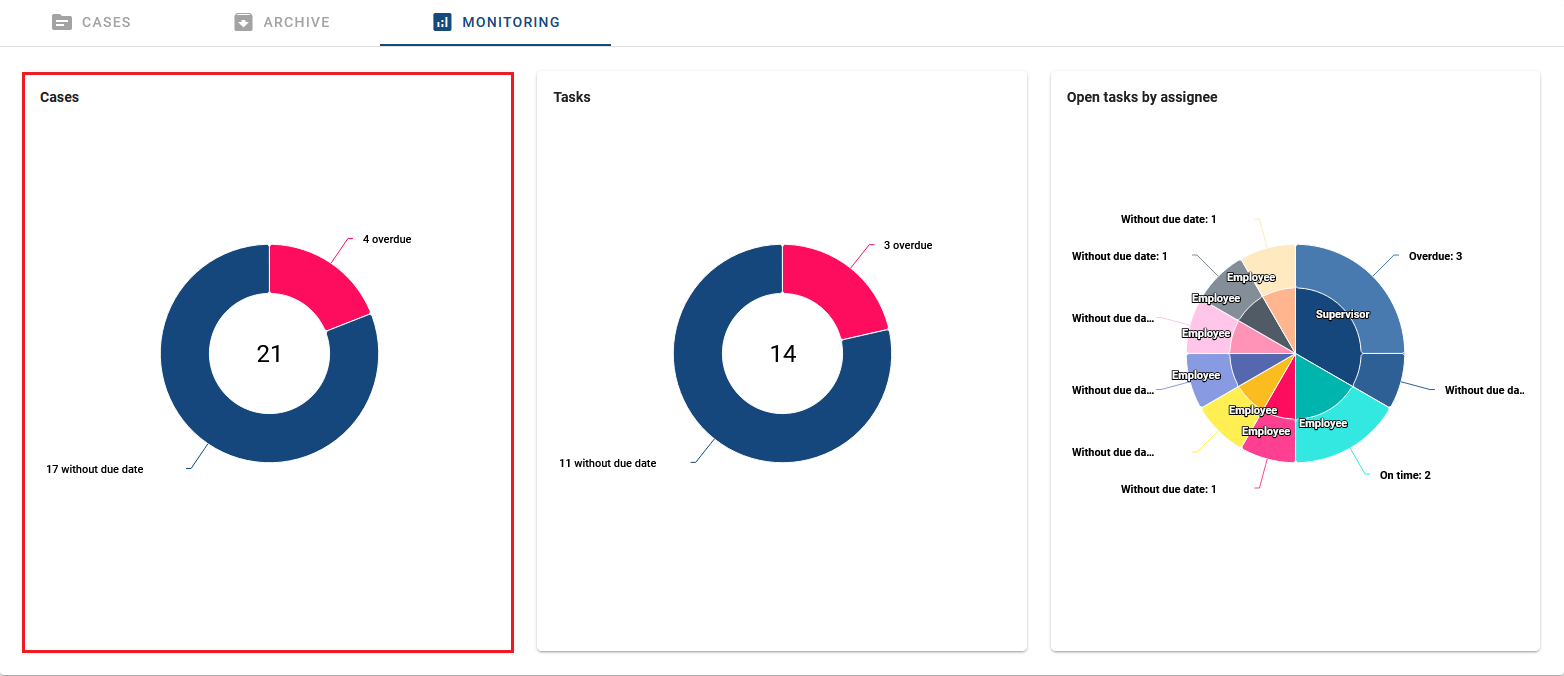
The number in the center of the diagram indicates the number of ongoing cases for the selected ProcessApp. Additionally, you can click on the ring of overdue cases in the donut chart. This will forward you to the case list of the corresponding ProcessApp, filtered according to the overdue cases. You can adjust the filters if necessary.
How can I monitor the status of open tasks for a ProcessApp?
When you open the Monitoring tab for a ProcessApp as a ProcessApp Administrator, you will see a Tasks tile with a summary of the status of the active tasks in a donut chart.
The donut chart is designed to visually display the task data. It is sorted clockwise and displays the following information in a specific order:
Number of open tasks: This value is displayed in the center of the chart and indicates the total number of tasks that are currently open and assigned to you.
Number of tasks completed on time: This data point is represented by a specific segment area on the chart. It represents the number of tasks that have been successfully completed within your designated time frame.
Number of overdue tasks: Another segment on the chart represents the number of tasks that have passed their designated due date and are now overdue.
Number of tasks with no due date: The chart also includes a segment that represents tasks that do not have a due date.
By viewing this donut chart, you can quickly assess the distribution of your active tasks based on their status.
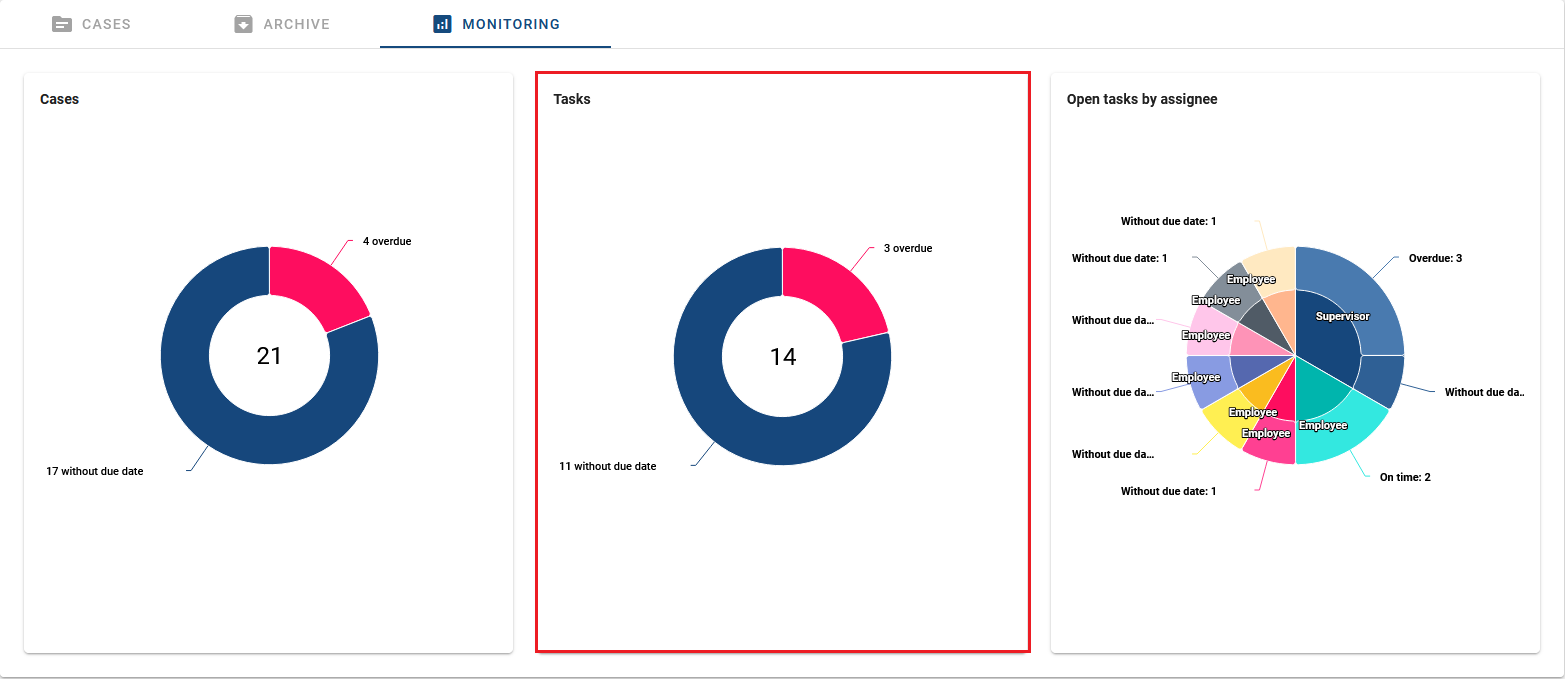
Additionally, you can click on the ring of overdue tasks in the donut chart. This will forward you to the task list of the corresponding ProcessApp, filtered according to the overdue tasks. You can adjust the filters if necessary.
How can I monitor the status of started tasks for a ProcessApp?
When you open the Monitoring tab for a ProcessApp as a ProcessApp Administrator, you will see an Open tasks by assignee (Top 10 results) tile with a summary of the status of all started tasks in a donut chart. The donut chart consists of two circles that are sorted clockwise:
The inner circle represents the assignees for the tasks. The names of the assignees are displayed.
The outer circle represents the task status and the number of started tasks for the assignees. The circle is divided into different segments that display the following information:
Number of tasks completed on time: This segment of the chart represents the number of tasks assigned to the particular assignee that have been successfully completed within their designated time frame.
Number of overdue tasks: Another segment of the chart represents the number of tasks that have passed their designated due date and are therefore overdue.
Number of tasks with no due date: The last segment in the chart shows the number of tasks that do not have a due date.
The donut chart gives you an overview of the current statistics of the started tasks, grouped by their respective assignees. The number of assignees displayed is reduced to the top 10 results.
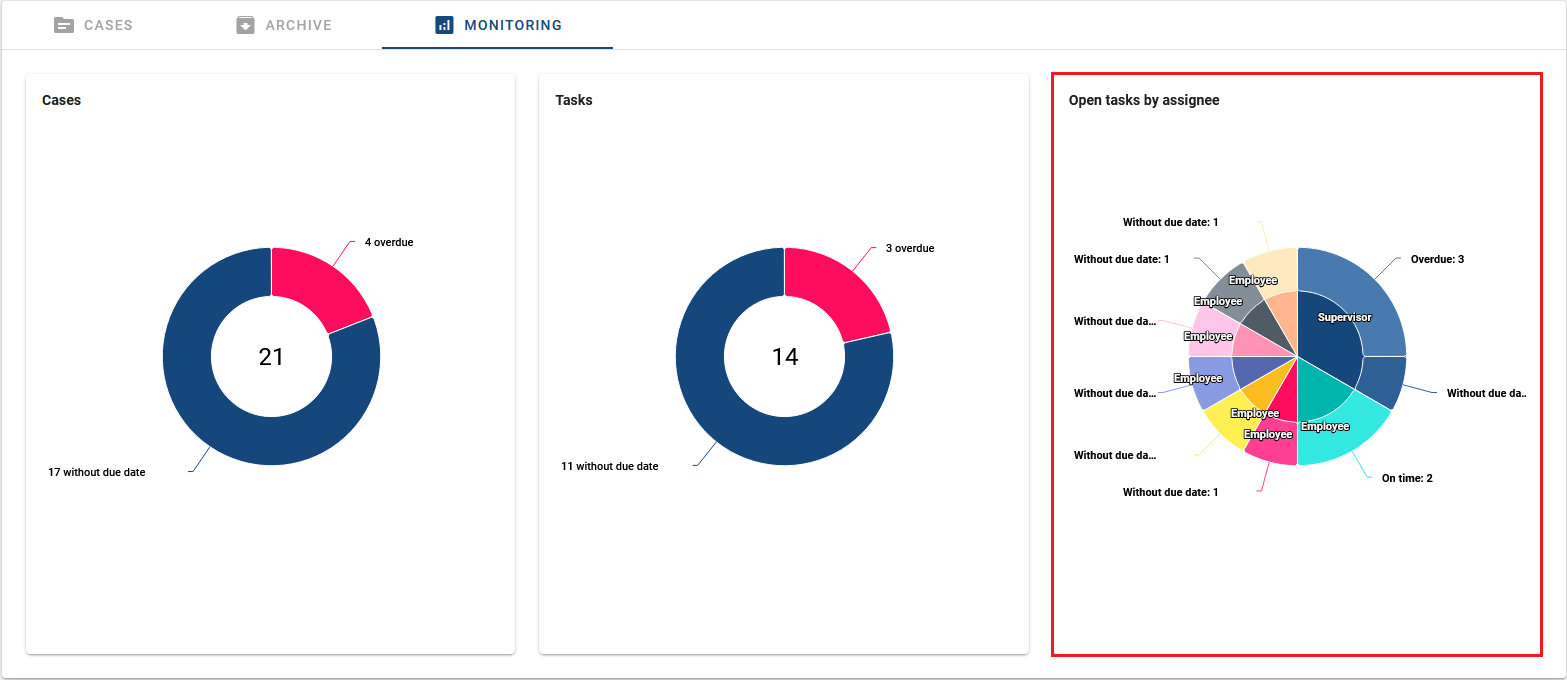
You can also click on the assignees within the inner circle. This will forward you to the task list of the corresponding ProcessApp, filtered according to the selected assignee. You can adjust the filters if necessary.
How can I monitor the end status of completed cases for a ProcessApp?
When you open the Monitoring tab for a ProcessApp as a ProcessApp Administrator, the Closed cases by status tile displays a graph that shows the end status of the closed cases, provided they were completed in the last 12 months. In order for the graph to be displayed, you must first set the status in your process.
Once you have defined the status, a graph appears to visually represent the closed cases. The Y-axis shows the percentage of end states achieved. The X-axis shows the last 12 months.
You can move your mouse over the graph to get more detailed information about the closed cases and their end status.
Additionally, you have the option to click on the closed cases by status for the respective month in the chart. You will then be forwarded to the case list of the corresponding ProcessApp. In this case list, all archived cases are filtered by the selected month and end status. You can adjust the filters if necessary.