Insights
Insights help you better understand and analyze relationships in your process landscape.
If you have also purchased the module Enterprise Architecture Management (EAM) and it has been activated for you, the Insights menu item provides you with additional display formats for analyzing your IT and process landscape, for example the application landscape, costs, or dependencies between objects. GBTEC Enterprise Architecture is a separate license and extends the analysis functions in GBTEC Process Design. These are described in the Insights chapter of GBTEC Enterprise Architecture.
Where can I find the Insights?
As a user with the Administrator, Editor, or Author user role, you can open the Insights without GBTEC Enterprise Architecture. Open the Insights menu item in the left menu bar. Only the Process hierarchy Insight in the Hierarchy section is then available to you.
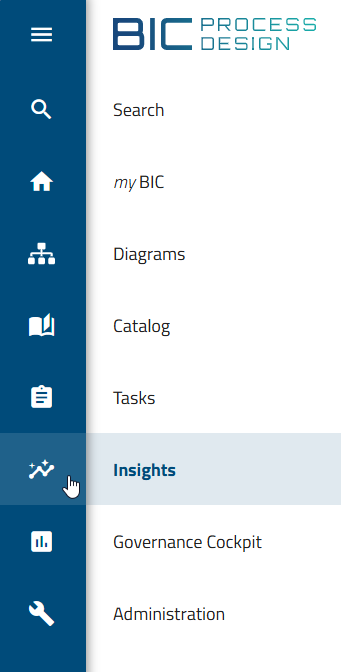
If you select a tile, the corresponding Insight opens.
Hierarchy
How is the process hierarchy displayed?
As a user with the Administrator, Editor, or Author user role, you can display the Process hierarchy Insight. To do this, open the Insights menu item in the left menu bar and select the Process hierarchy tile in the Hierarchy section.
After opening it, a note is displayed first. There, you are asked to select a start process. In the right sidebar, in the Settings panel, you can select a start diagram as a start process. This diagram forms the starting point of the display. All diagrams for which no access restrictions apply are available.
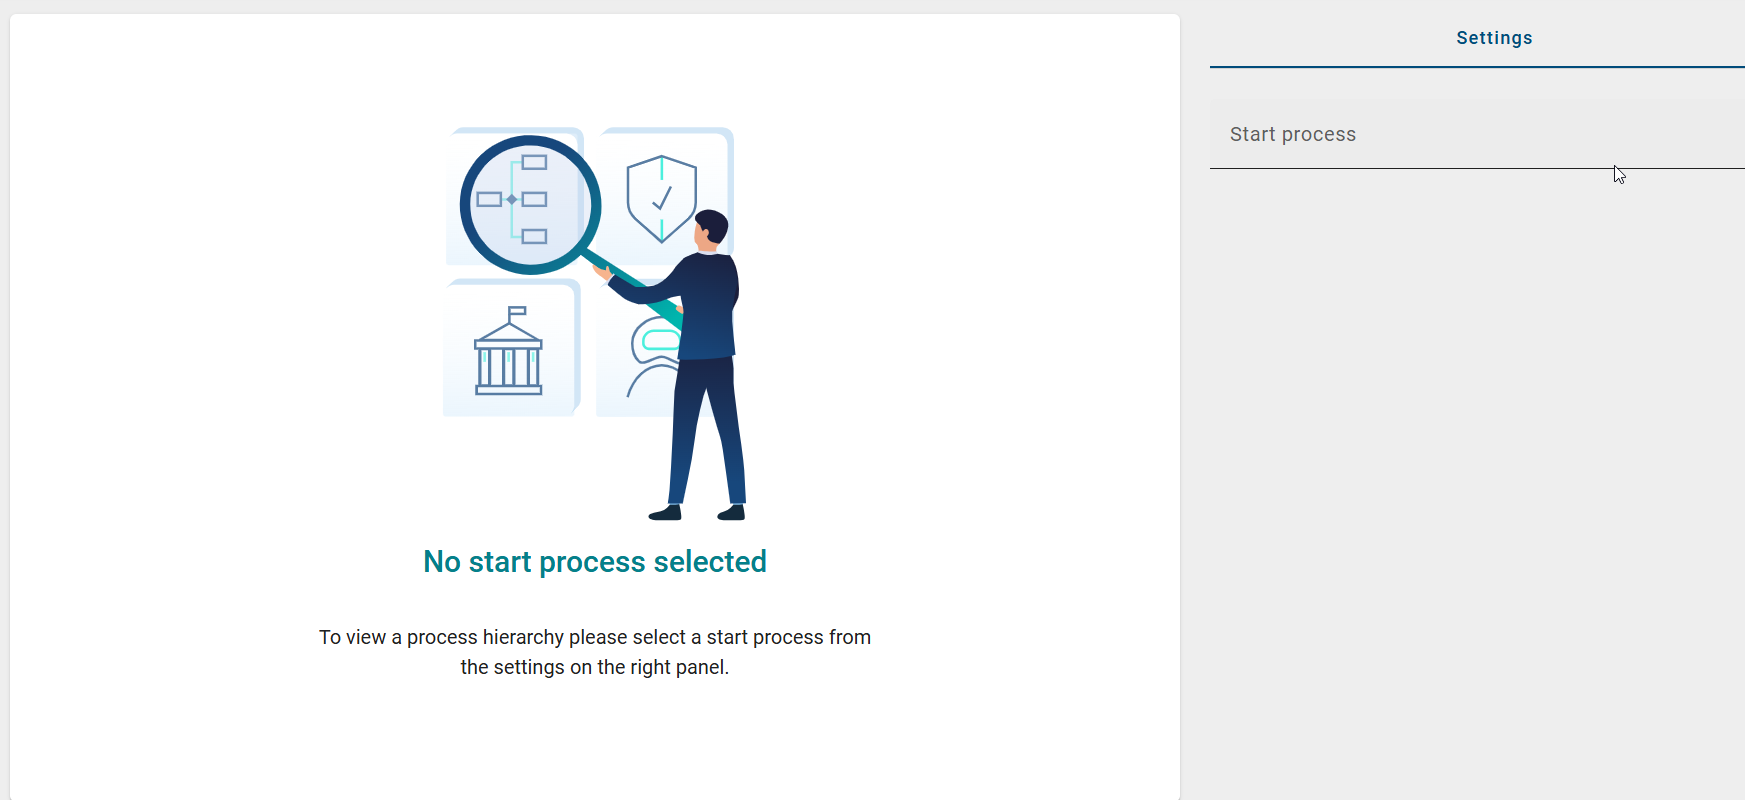
The selected start diagram must contain at least one subprocess (VCD, BPMN, or EPC). It is shown in the center of the display. All related subprocesses are loaded automatically. They are shown in several levels.
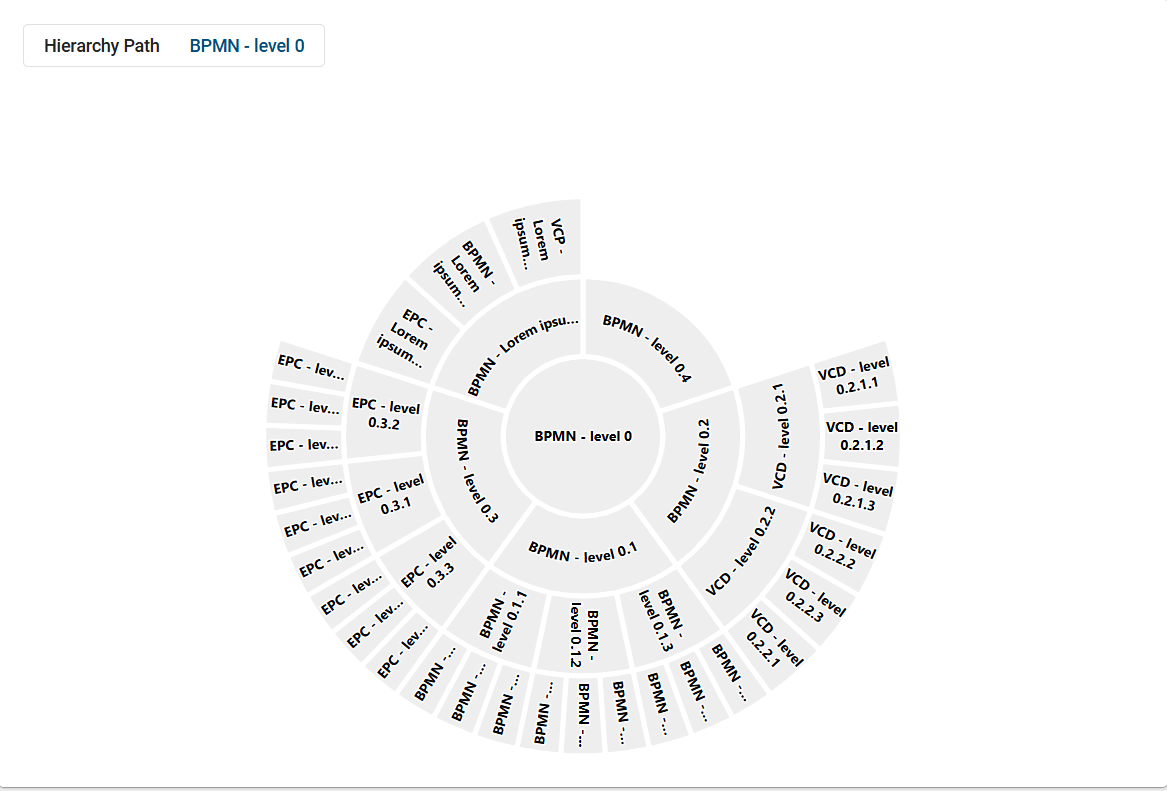
The display is shown as a sunburst diagram:
Each level is shown as a ring
The segments stand for individual processes
This helps you see how processes are connected and how they are structured. If the selected start diagram does not contain any subprocesses, no hierarchy can be displayed.
How can I navigate in the process hierarchy?
As a user with the Administrator, Editor, or Author user role, you can navigate within the Process hierarchy Insight. To do this, open the Insights menu item in the left menu bar and select the Process hierarchy tile in the Hierarchy section. Then select a start diagram.
After a start process has been selected, a sunburst diagram is displayed. Click a segment in the diagram to move deeper into the hierarchy. The selected segment then becomes the new center.
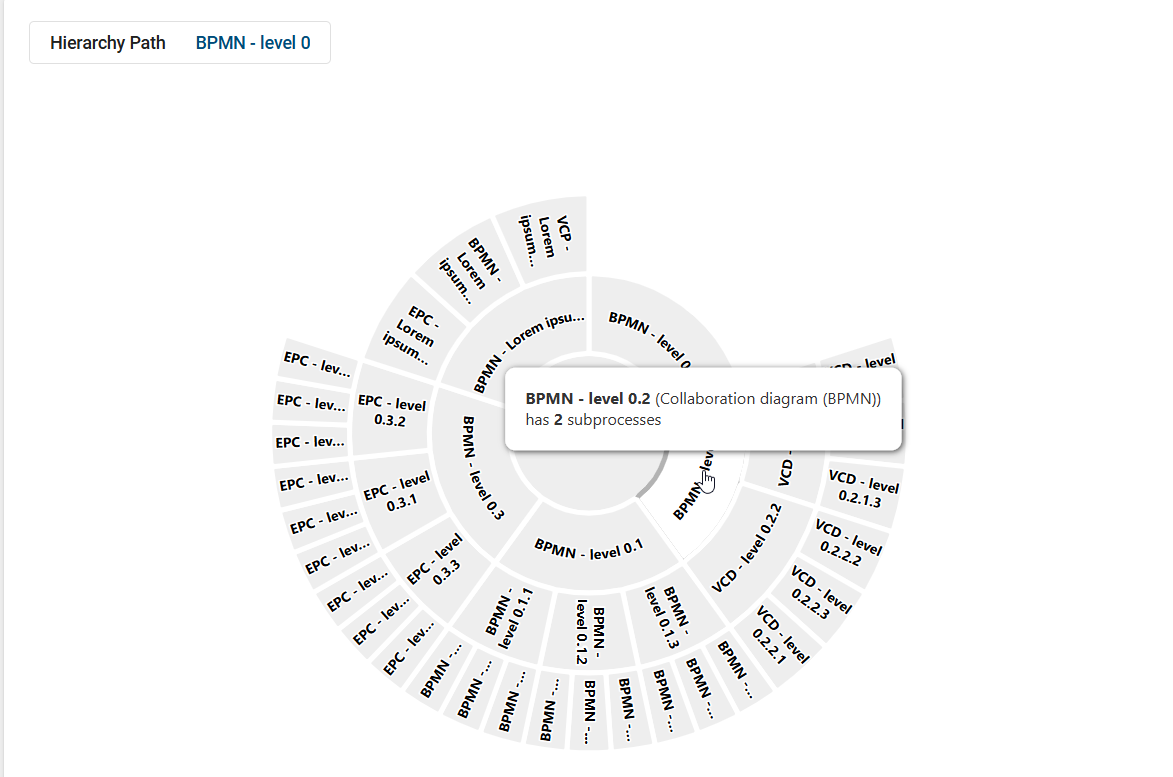
The subordinate processes are displayed in the outer rings. To move up one level again, click in the center of the diagram or use the navigation in the header.
When you move the mouse over a segment, additional information is displayed.
This includes:
the name of the process
the diagram type
the current level in the hierarchy
Note
Please note that a maximum of three rings are displayed at the same time. This keeps the display clear even when there are many processes. Processes can appear more than once if they are used in several parent processes.
How can I color processes in the process hierarchy?
As a user with the Administrator, Editor, or Author user role, you can color processes in the Process hierarchy Insight. To do this, open the Insights menu item in the left menu bar and select the Process hierarchy tile in the Hierarchy section. Then select a start process.
In the right sidebar, in the Settings panel, you will find the Coloring option.
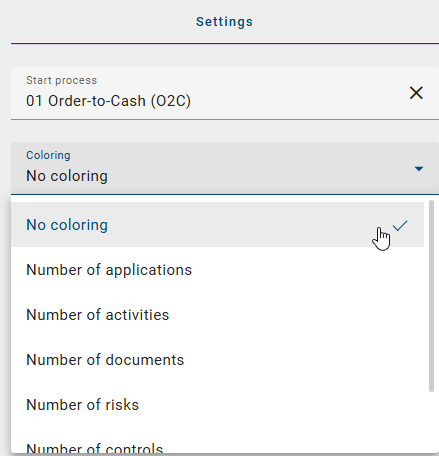
You can choose which criterion is used to color the processes. For example, the following options are available:
Number of applications
Number of activities
Number of documents
Number of risks
Number of controls
Number of roles
As soon as you select an option, the coloring is applied directly. The legend is updated automatically.

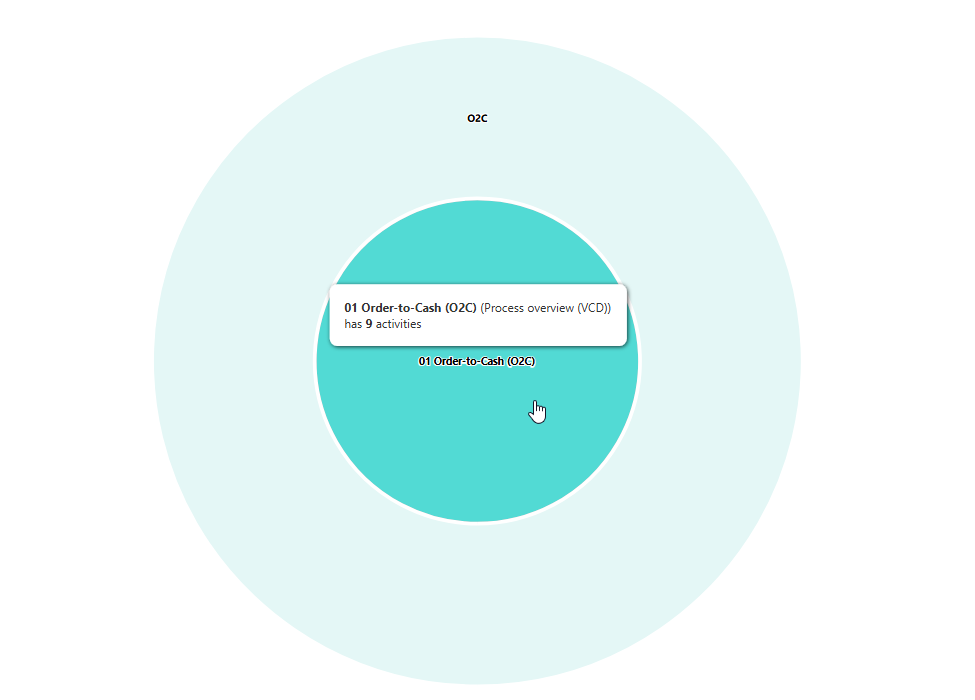
When you move the mouse over a segment, you also see the exact number of contained objects.
How can I display the details of a process in the process hierarchy?
As a user with the Administrator, Editor, or Author user role, you can display the details of a process in the Process hierarchy Insight. To do this, open the Insights menu item in the left menu bar and select the Process hierarchy tile in the Hierarchy section. Then select a start diagram.
After a start process has been selected, a sunburst diagram is displayed. Right-click a segment in the diagram and select the Show attributes option.
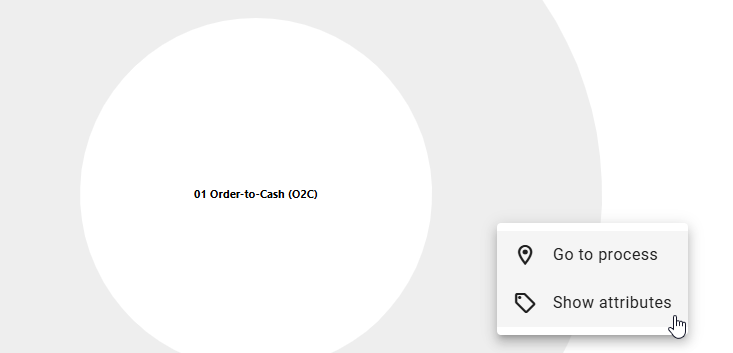
The details are displayed in the right sidebar. There, you will see all available information about the selected process.
How can I switch to a process within the process hierarchy?
As a user with the Administrator, Editor, or Author user role, you can switch to a process within the Process hierarchy Insight. To do this, open the Insights menu item in the left menu bar and select the Process hierarchy tile in the Hierarchy section. Then select a start diagram.
After a start process has been selected, a sunburst diagram is displayed. Right-click a segment in the diagram and select the Go to process option.
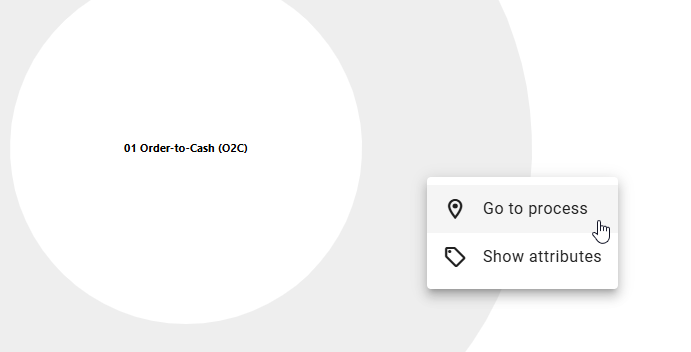
You are taken directly to the corresponding process. The view opens in the current repository and stage.