Simulation
BIC Process Design offers you the possibility to simulate your processes. This functionality can be used for all processes modeled in a BPMN diagram.
Process costs, cycle time and further KPIs for your process can be calculated in a simulation. The results can help you to estimate the effect of process changes without having to use actual resources of your organization. This helps you to determine the optimum of your process to reduce costs and support the efficient use of resources.
Create a scenario with hypothetical parameters defining how your process could be performed. A simulation executes the scenario according to your specification and provides results to analyze bottlenecks, cycle times and the costs of your processes. You can create different scenarios to analyze the maximum potential of your process and make it more cost and resource efficient.
Note
The process simulation is not available on mobile devices.
How can I start a simulation of my process?
In order to simulate a process in BIC Process Design, you may create a concrete scenario. In a scenario, the number of process instances and the duration of the simulation can be defined. When all process steps (i.e. activities) and resources of the process are specified with hypothetical values, the simulation can be started.
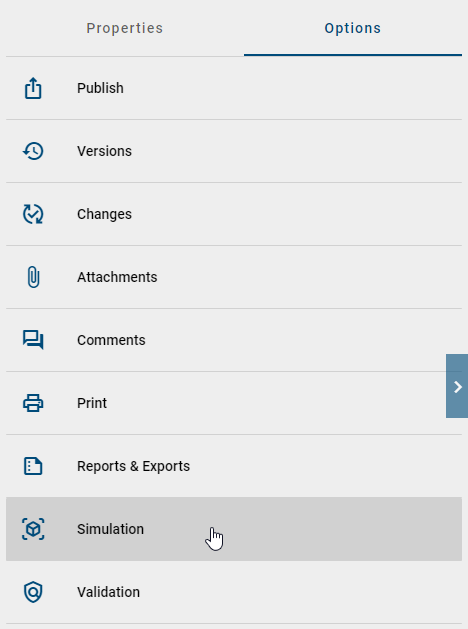
To create a scenario, navigate to the diagram view of your BPMN diagram and select the option Simulation.
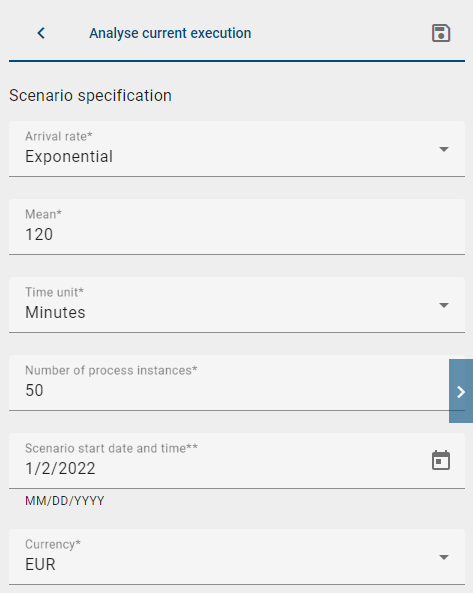
The form for the scenario specification opens in the sidebar. All fields can be edited after clicking them. At first, you can enter the name of your scenario. The following list describes the purpose of each field:
Distribution: Depending on the selected distribution you will get different parameters. Here you can find details of the different distributions.
Time unit: What is the time unit for the input fields.
Number of process instances: How many process instances will be started in the simulation? A maximal number of 1000 instances is possible.
Scenario start date and time: When does the simulation start?
Currency: Which currency is used to calculate the total cost?
When creating a scenario, it is required to rate the financial and temporal expense of the single process steps (i.e. the tasks for participants of the process). Select an activity in the diagram to open the corresponding form in the sidebar. You may set the following parameters there:
Duration:
Distribution: Depending on the selected distribution you will get different parameters. Here you can find details of the different distributions.
Time unit: What is the time unit for the input fields.
Fixed costs and threshold:
Fixed costs: What are the costs for this process step?
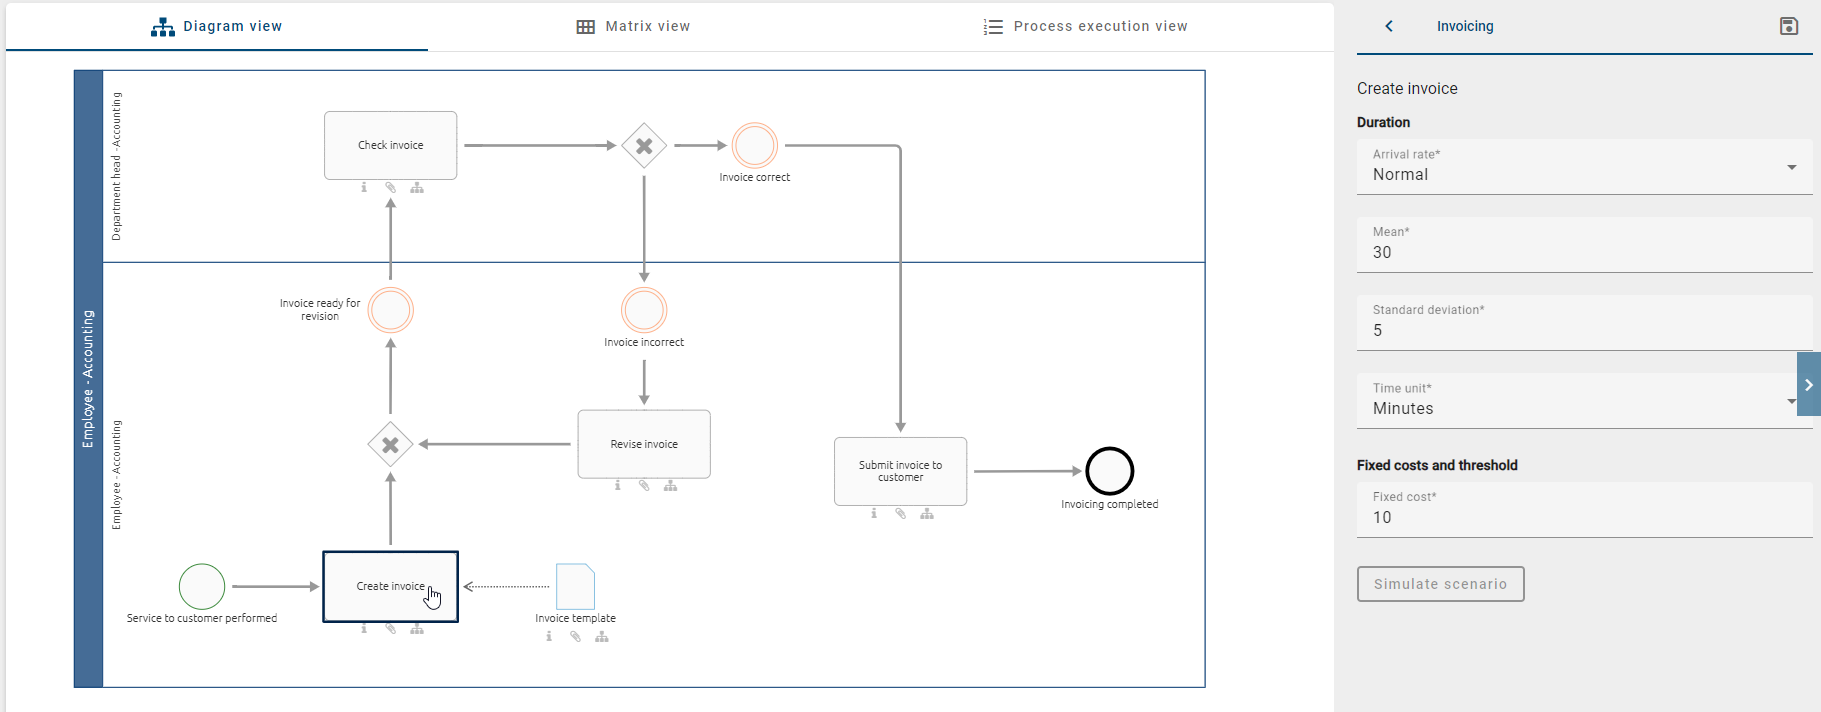
Define these parameters for each process step. You can switch to the scenario specification form by a click on an empty space.
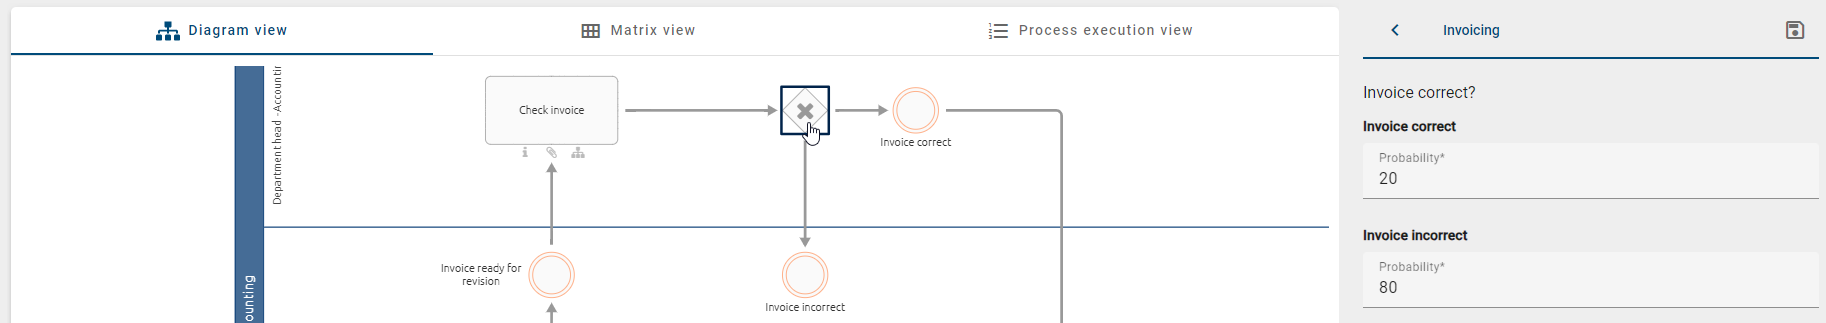
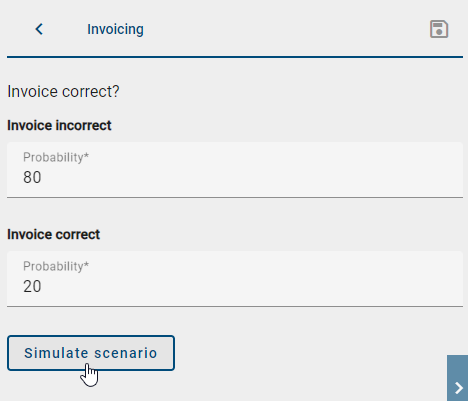
If there are gateways modeled in the diagram, you have to set probabilities of the outgoing paths. This is required for XOR and OR gateways that have more than one outgoing path. You cannot set probabilities for a parallel gateway, all outgoing paths will always be executed. The sidebar will show the corresponding form when you select a gateway in the diagram. The form is a list of the directly following process steps with a field Probability for each. Enter the probability that the process step is chosen at the gateway in percentage between 0 and 100. The following logic applies to the different gateway types:
Exclusive or (XOR): The sum of the probabilities of all following paths has to be 100%. In each process instance that is simulated, exactly one path is executed.
Inclusive or (OR): The probability of each outgoing path can be between 0% and 100%. During the simulation of a process instance at least one path is executed and the total number is depending on your settings.
After all parameters are set, save the parameters and initiate the simulation by selecting the button Simulate Scenario.
How can I save my entered simulation parameter?
As a simulation user, you have the option of saving your entered simulation parameters in order to continue working on them later.
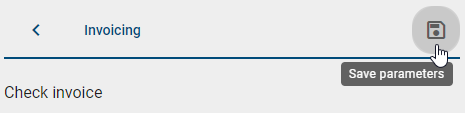
To start the simulation, click on Simulate scenario. Enter a name for the scenario in the corresponding input field and click on Create scenario. If you have made changes to the parameters, you can save them by clicking on Save parameters.
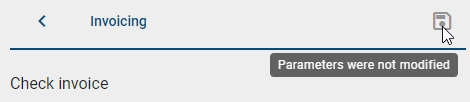
If no changes have been made, the corresponding button to save a parameter is disabled. Additionally, you will be notified with a hint about this.
Before you can start the simulation, you must enter and save the required parameters for the scenario. Appropriate input fields are provided for this purpose. If you want to return to the overview of saved scenarios, use the Back to saved scenarios button.

To exit the simulation and return to the diagram view, select Back to options list. You also have the option to open a single saved scenario. To do this, click on the tooltip Open Scenario. This will take you to the corresponding scenario with all the saved parameters.
Warning
As soon as changes are made to the diagram, a new scenario must also be created.
Hint
Please note that if you have made changes to the scenario parameters and want to exit the simulation without saving, you will receive a hint. You can choose whether you want to save the parameters or not. The dialogue offers you the options Cancel and Save.
How can I specify my resources in a simulation?
In a scenario, resources are very important. Mostly, a resource represents a concrete role in your company. In a BPMN diagram, it is modeled as a separate lane.
How can I change the details of my resource?
When you want to change the details of a resource in your process, you can click on the BPMN lane of the resource you want to change. On the right-hand side a window appears where you can change the details of your resource. You can see the name of your resource on the top.
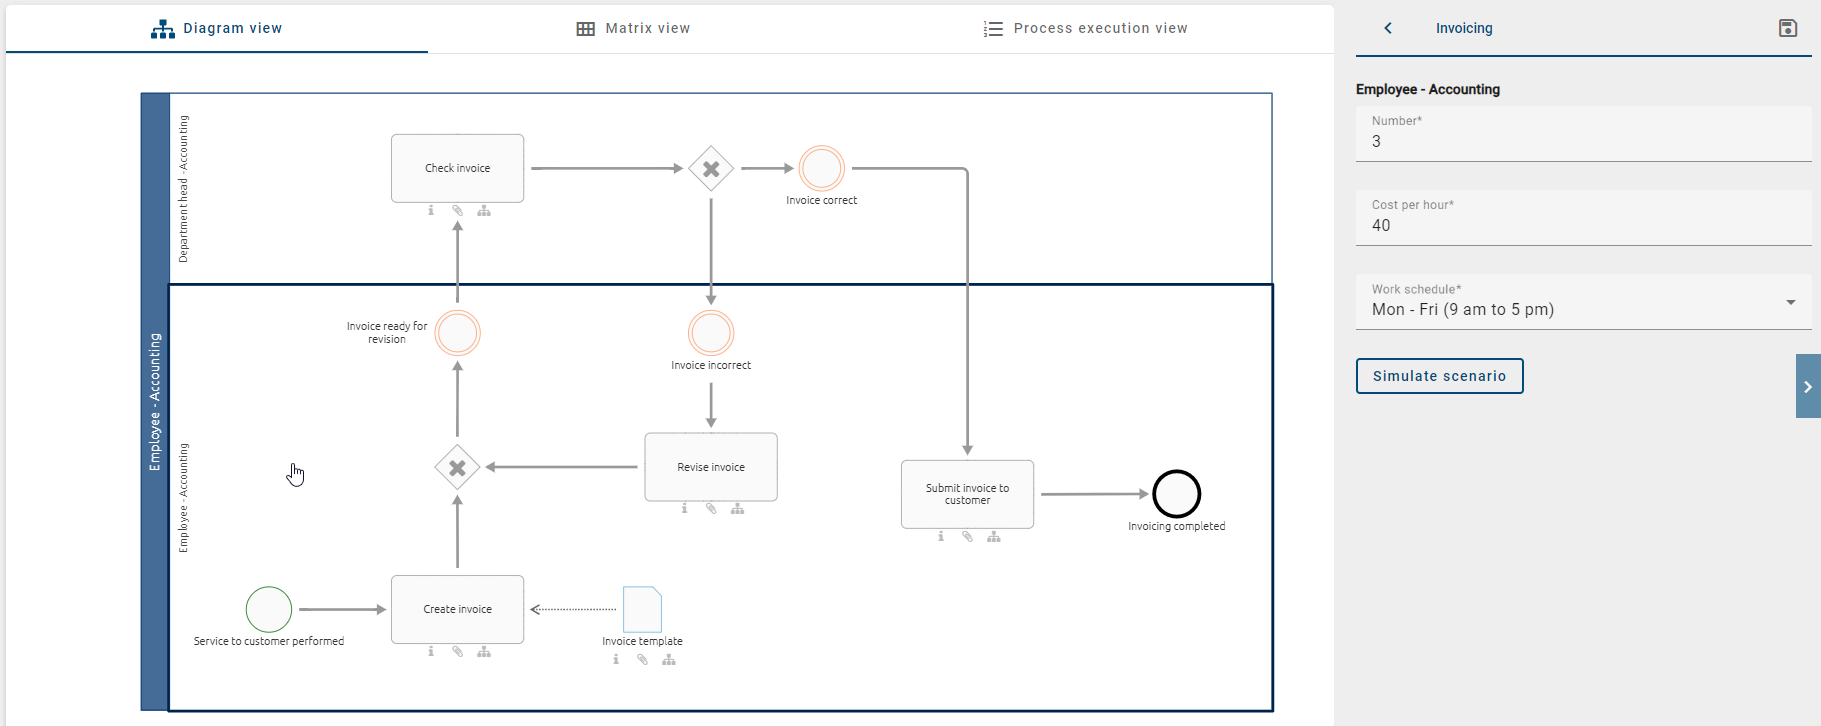
Number: Here you can enter how many resources of this type are available. You can only enter integers. Mostly this number represents how many employees you got for a certain role.
Cost per hour: Here you can enter what the resource is costing you per hour. This can be the hourly wage of your employee.
Work schedule: Here you can select when the resource is available. By default you got two different options: Mon-Fri (9 am to 5 pm) and 24/7. Mon-Fri (9 am to 5 pm) means that your resource is available from Monday to Friday from 9:00 am to 5:00 pm. 24/7 means that your resource is always available.
Note
Be aware that a resource can only work on one activity at the same time. That means it is not possible for a resource to work simultaneously on two different activities. Vice versa, an activity can also only be worked on by one resource at a time.
Which distribution types can I choose and what do they look like?
In the real world it is usually not common that an instance of a process always lasts the same time. Therefore you have the option to choose from different distribution types which will make your simulation more realistic. It is helpful to collect real process data to determine the best approximation for your distribution.
In the following chapter you will find an explanation of the different distribution types and their needed parameters. Also you will find a graph which shows the distribution. On the x-axis you can see the time, and on the y-axis the probability that a task will take this time.
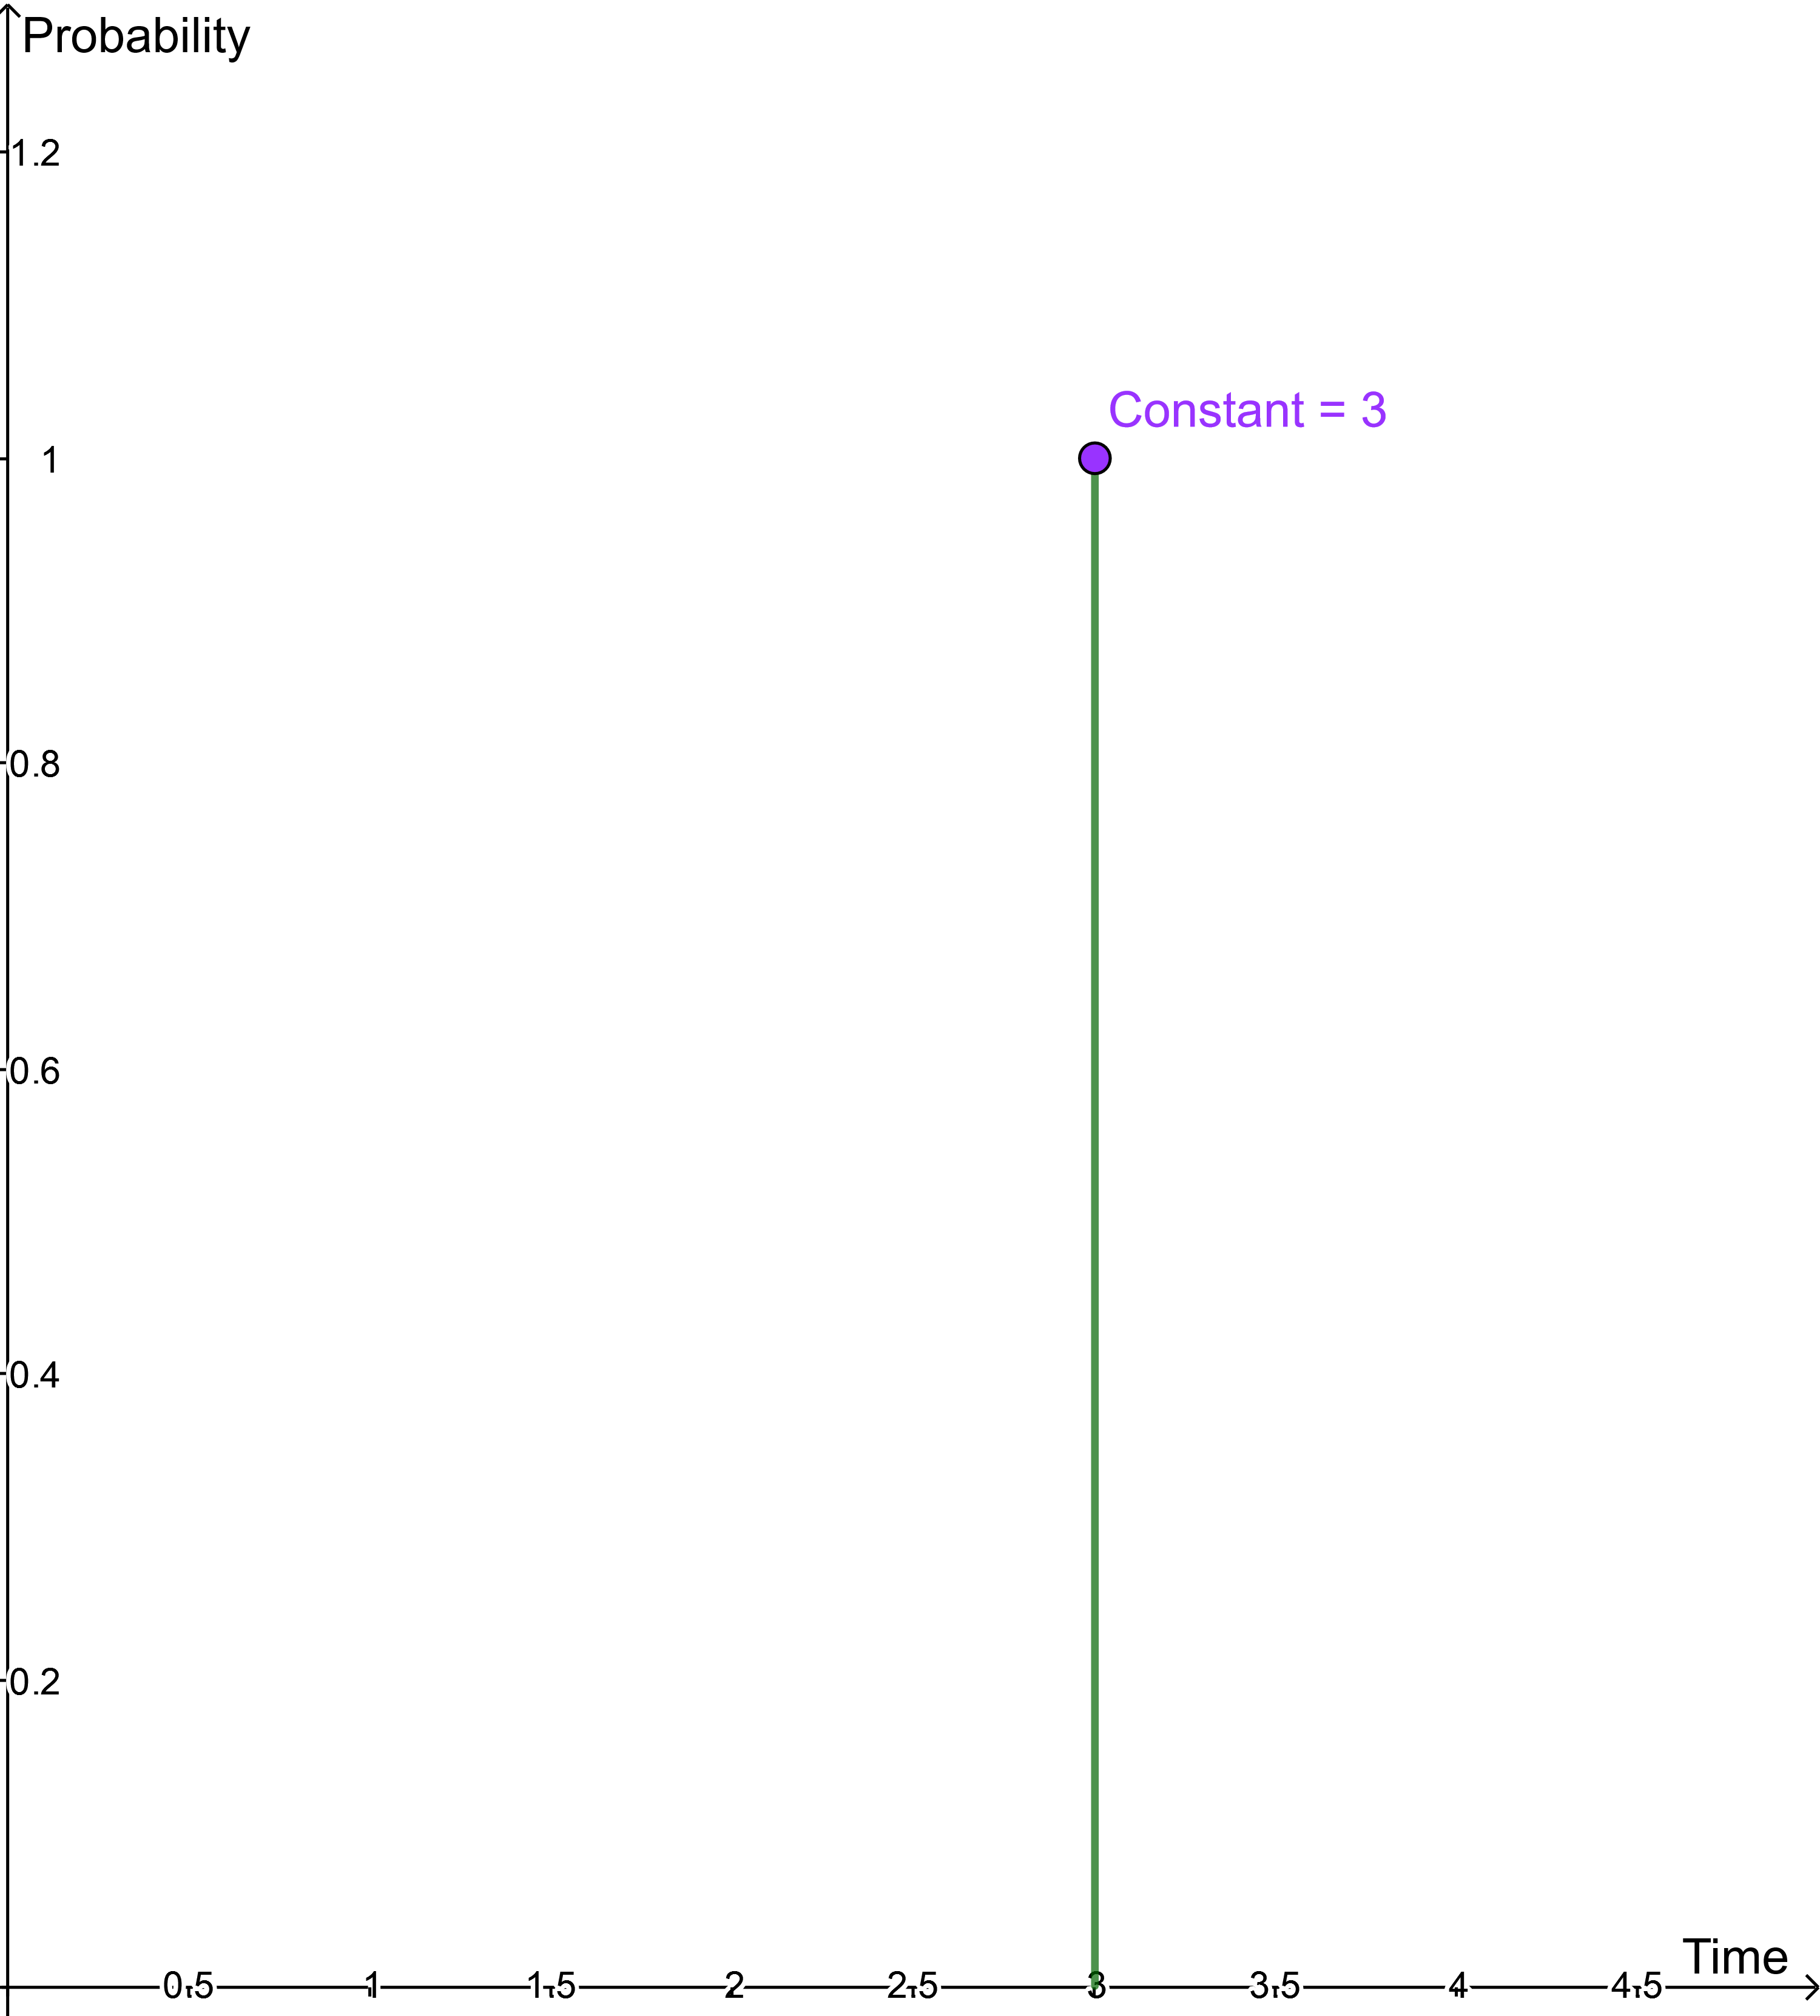
Fixed:
With the constant distribution you assume that your task takes a constant time. This distribution needs only one parameter To. Every task in the simulation will then need exactly this time. Therefore the probability is 100% for this exact time.
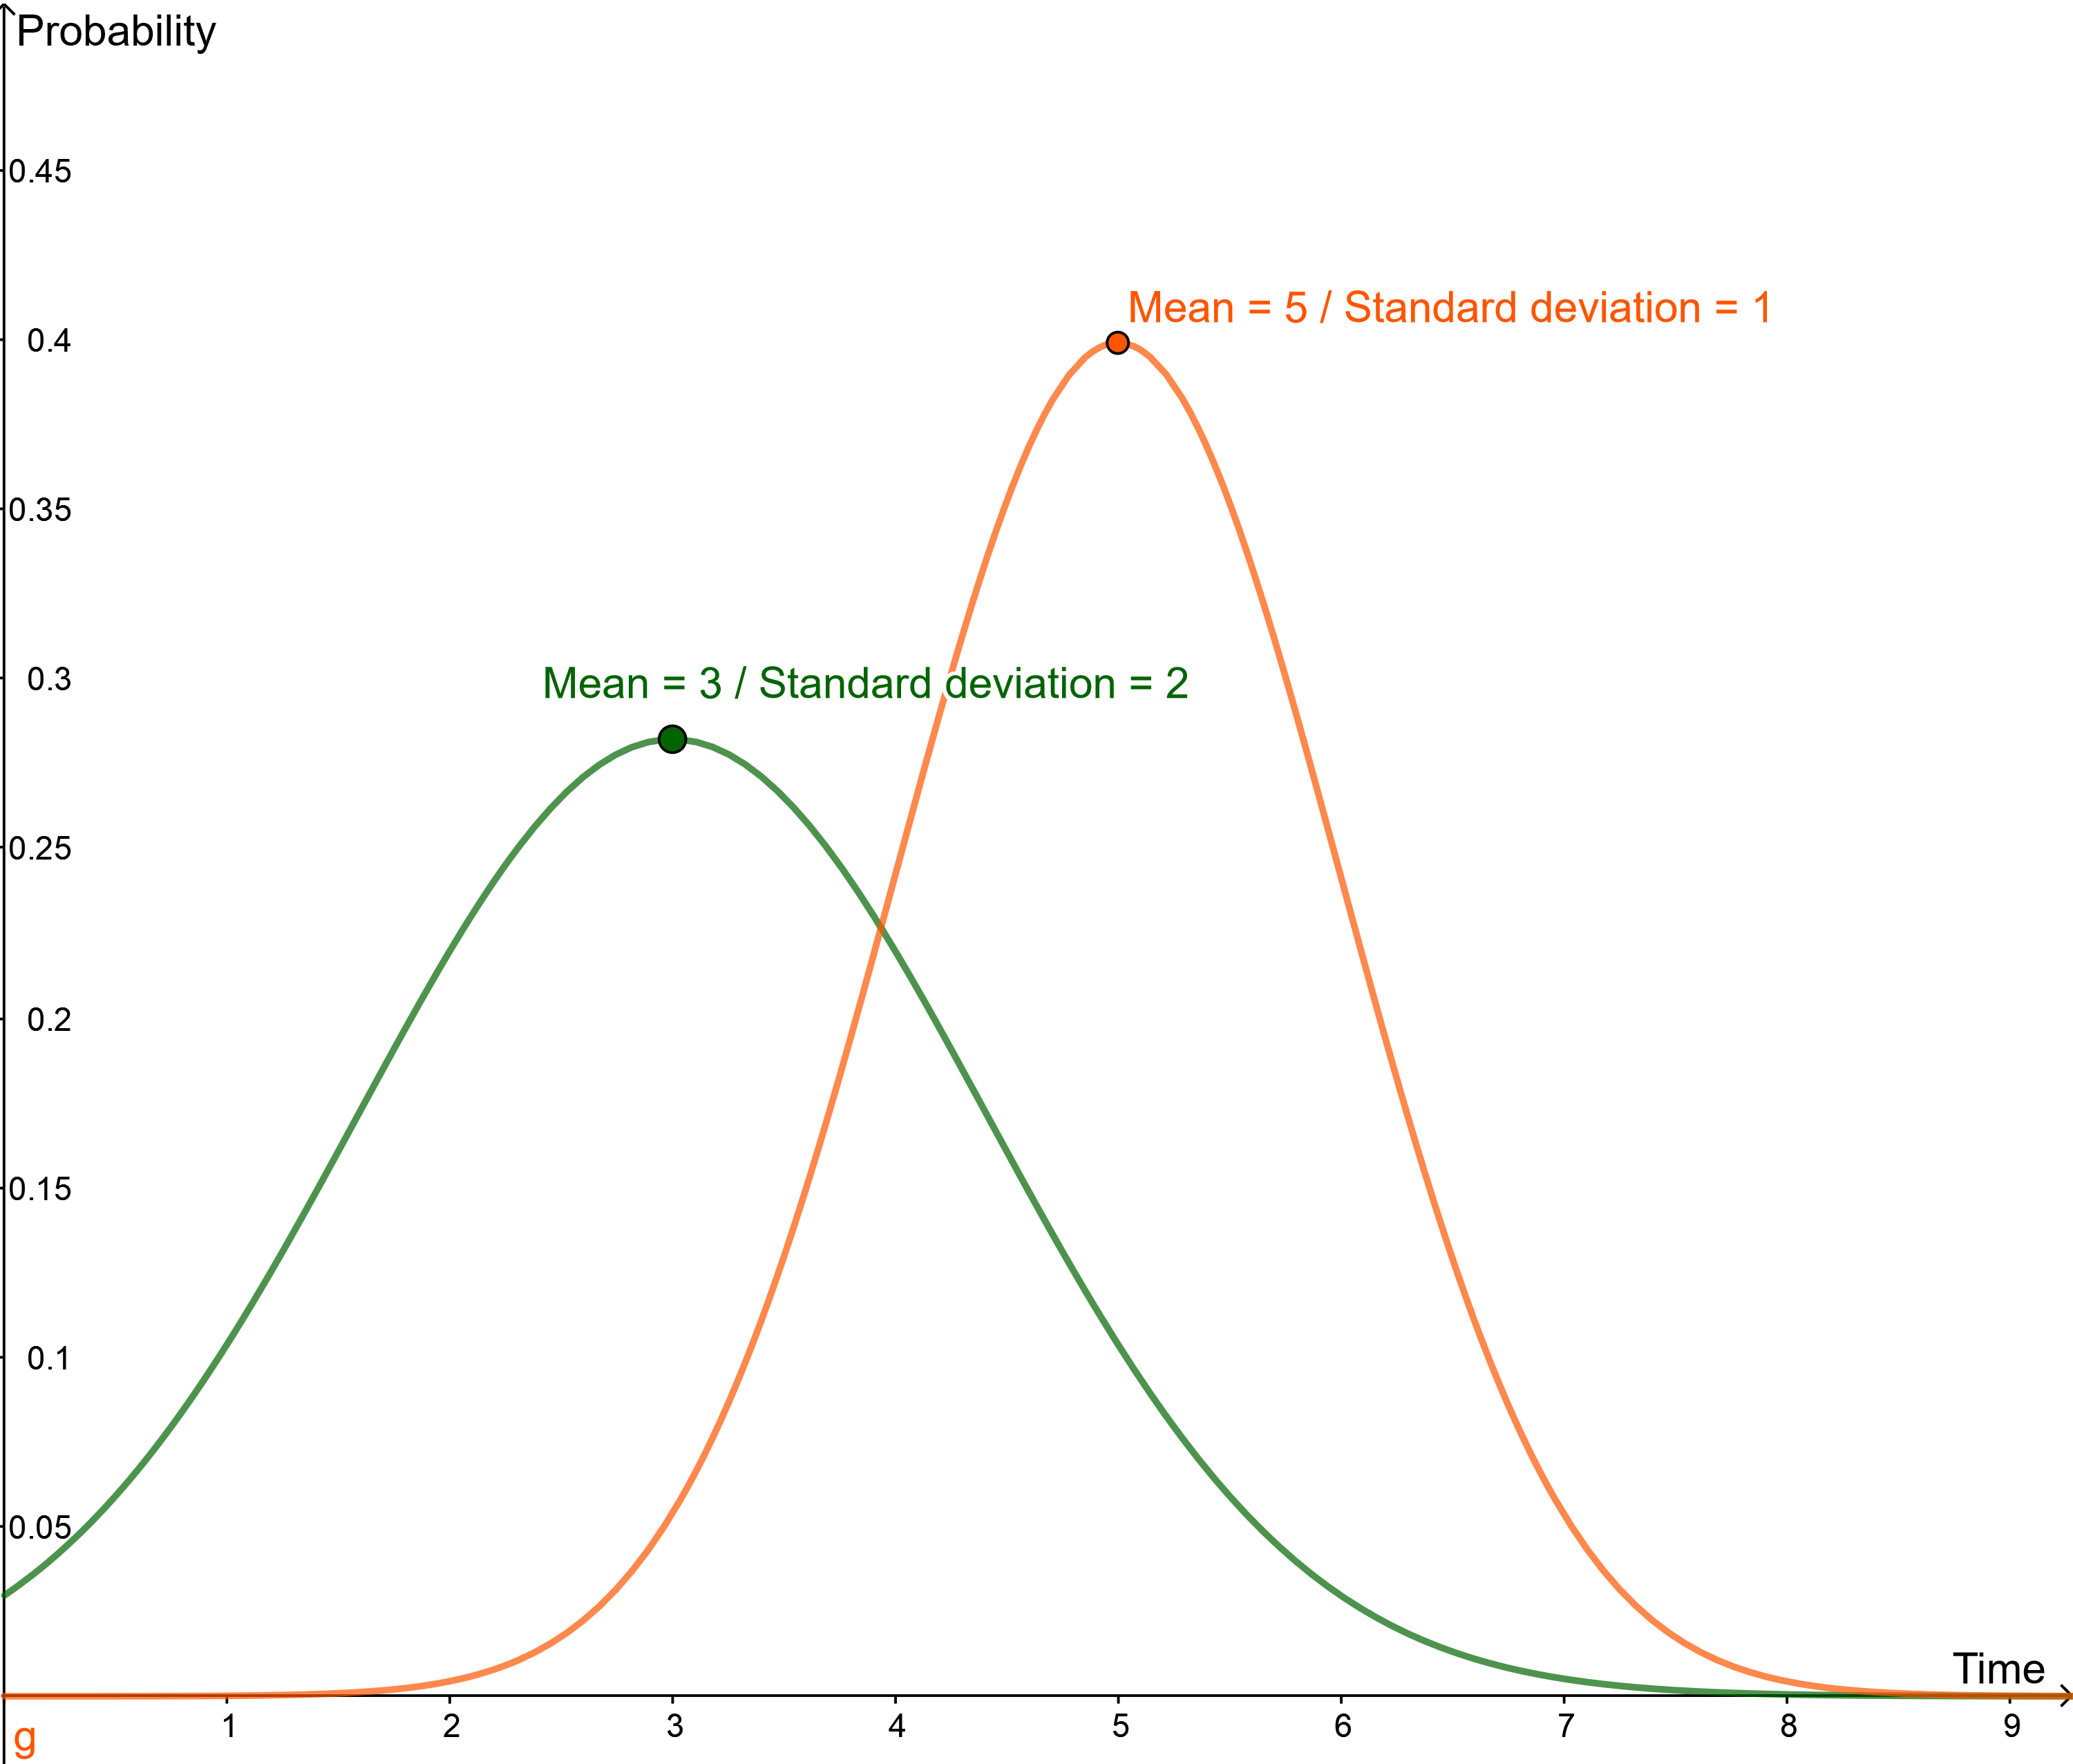
Normal:
With the help of this distribution function, deviations from the norm or the expected value can be modeled very well. The normal distribution requires the input parameters Mean and Standard deviation. The Mean represents the time with the highest probability. The Standard deviation describes the deviation from the Mean. If this value is bigger than 1, the deviation will be bigger. If the value is less than 1 the deviation will be smaller.
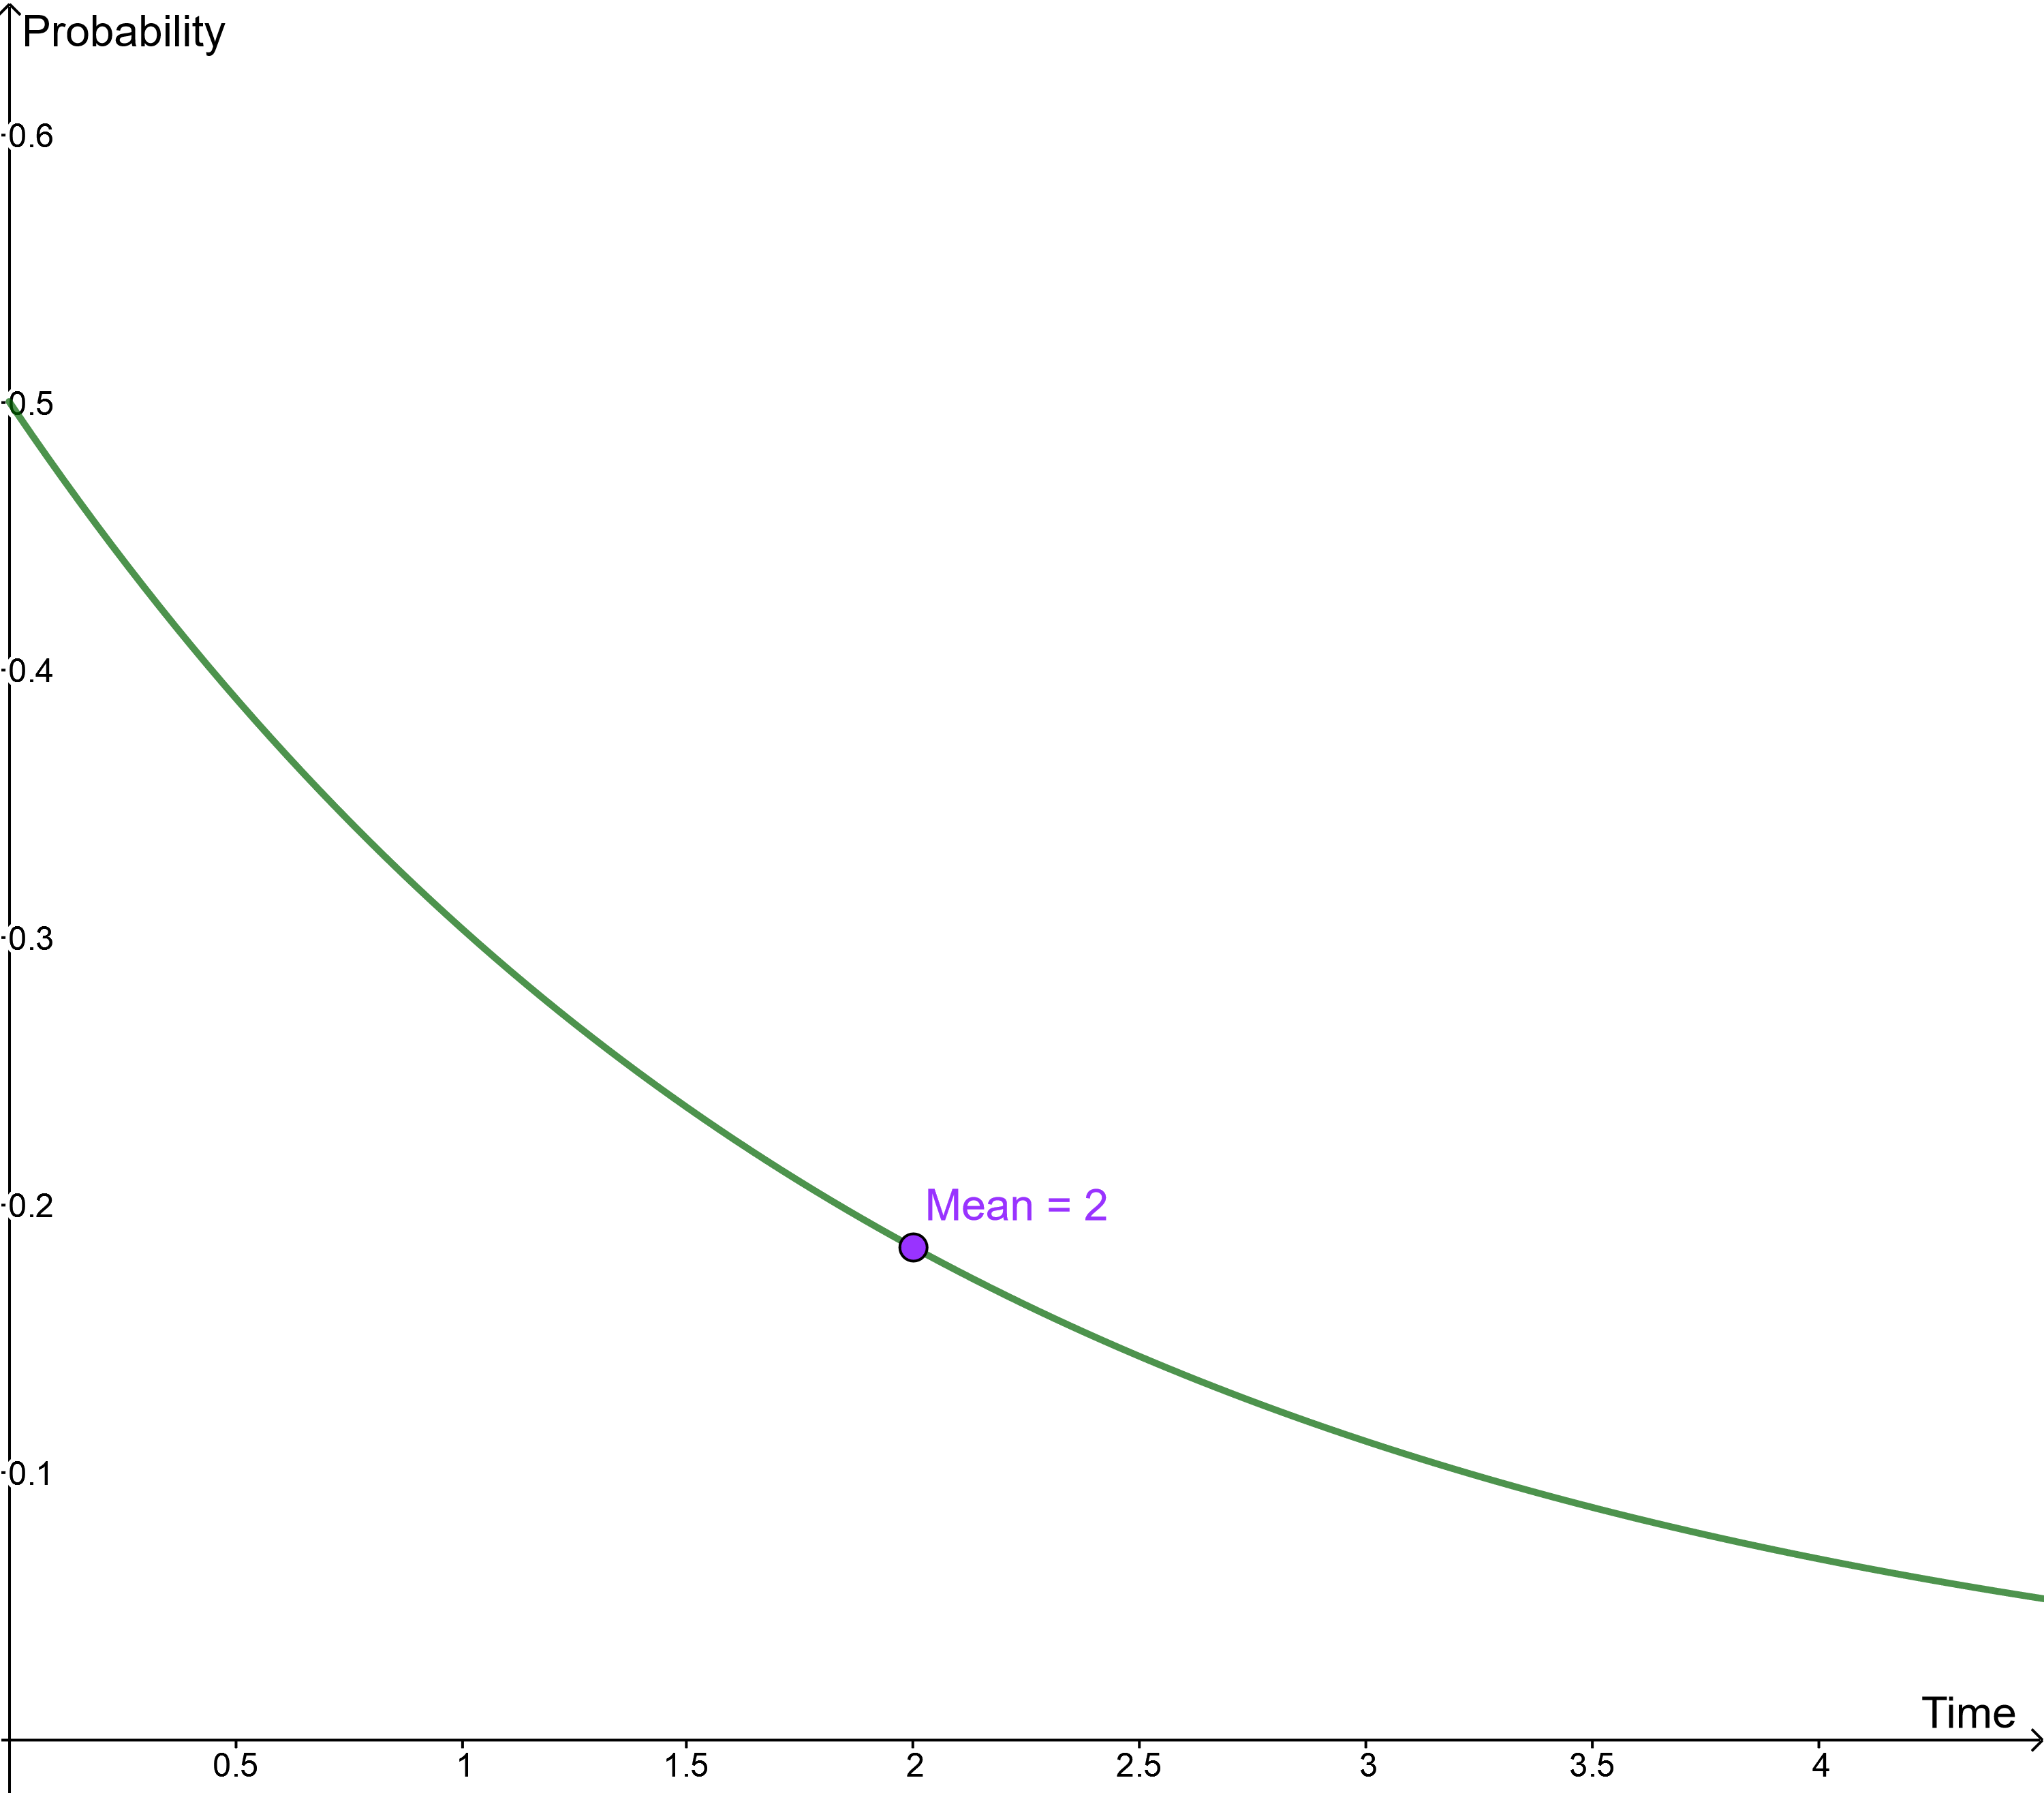
Exponential:
This distribution function allows a realistic approximation for different time intervals. The distribution only needs the parameter Mean.
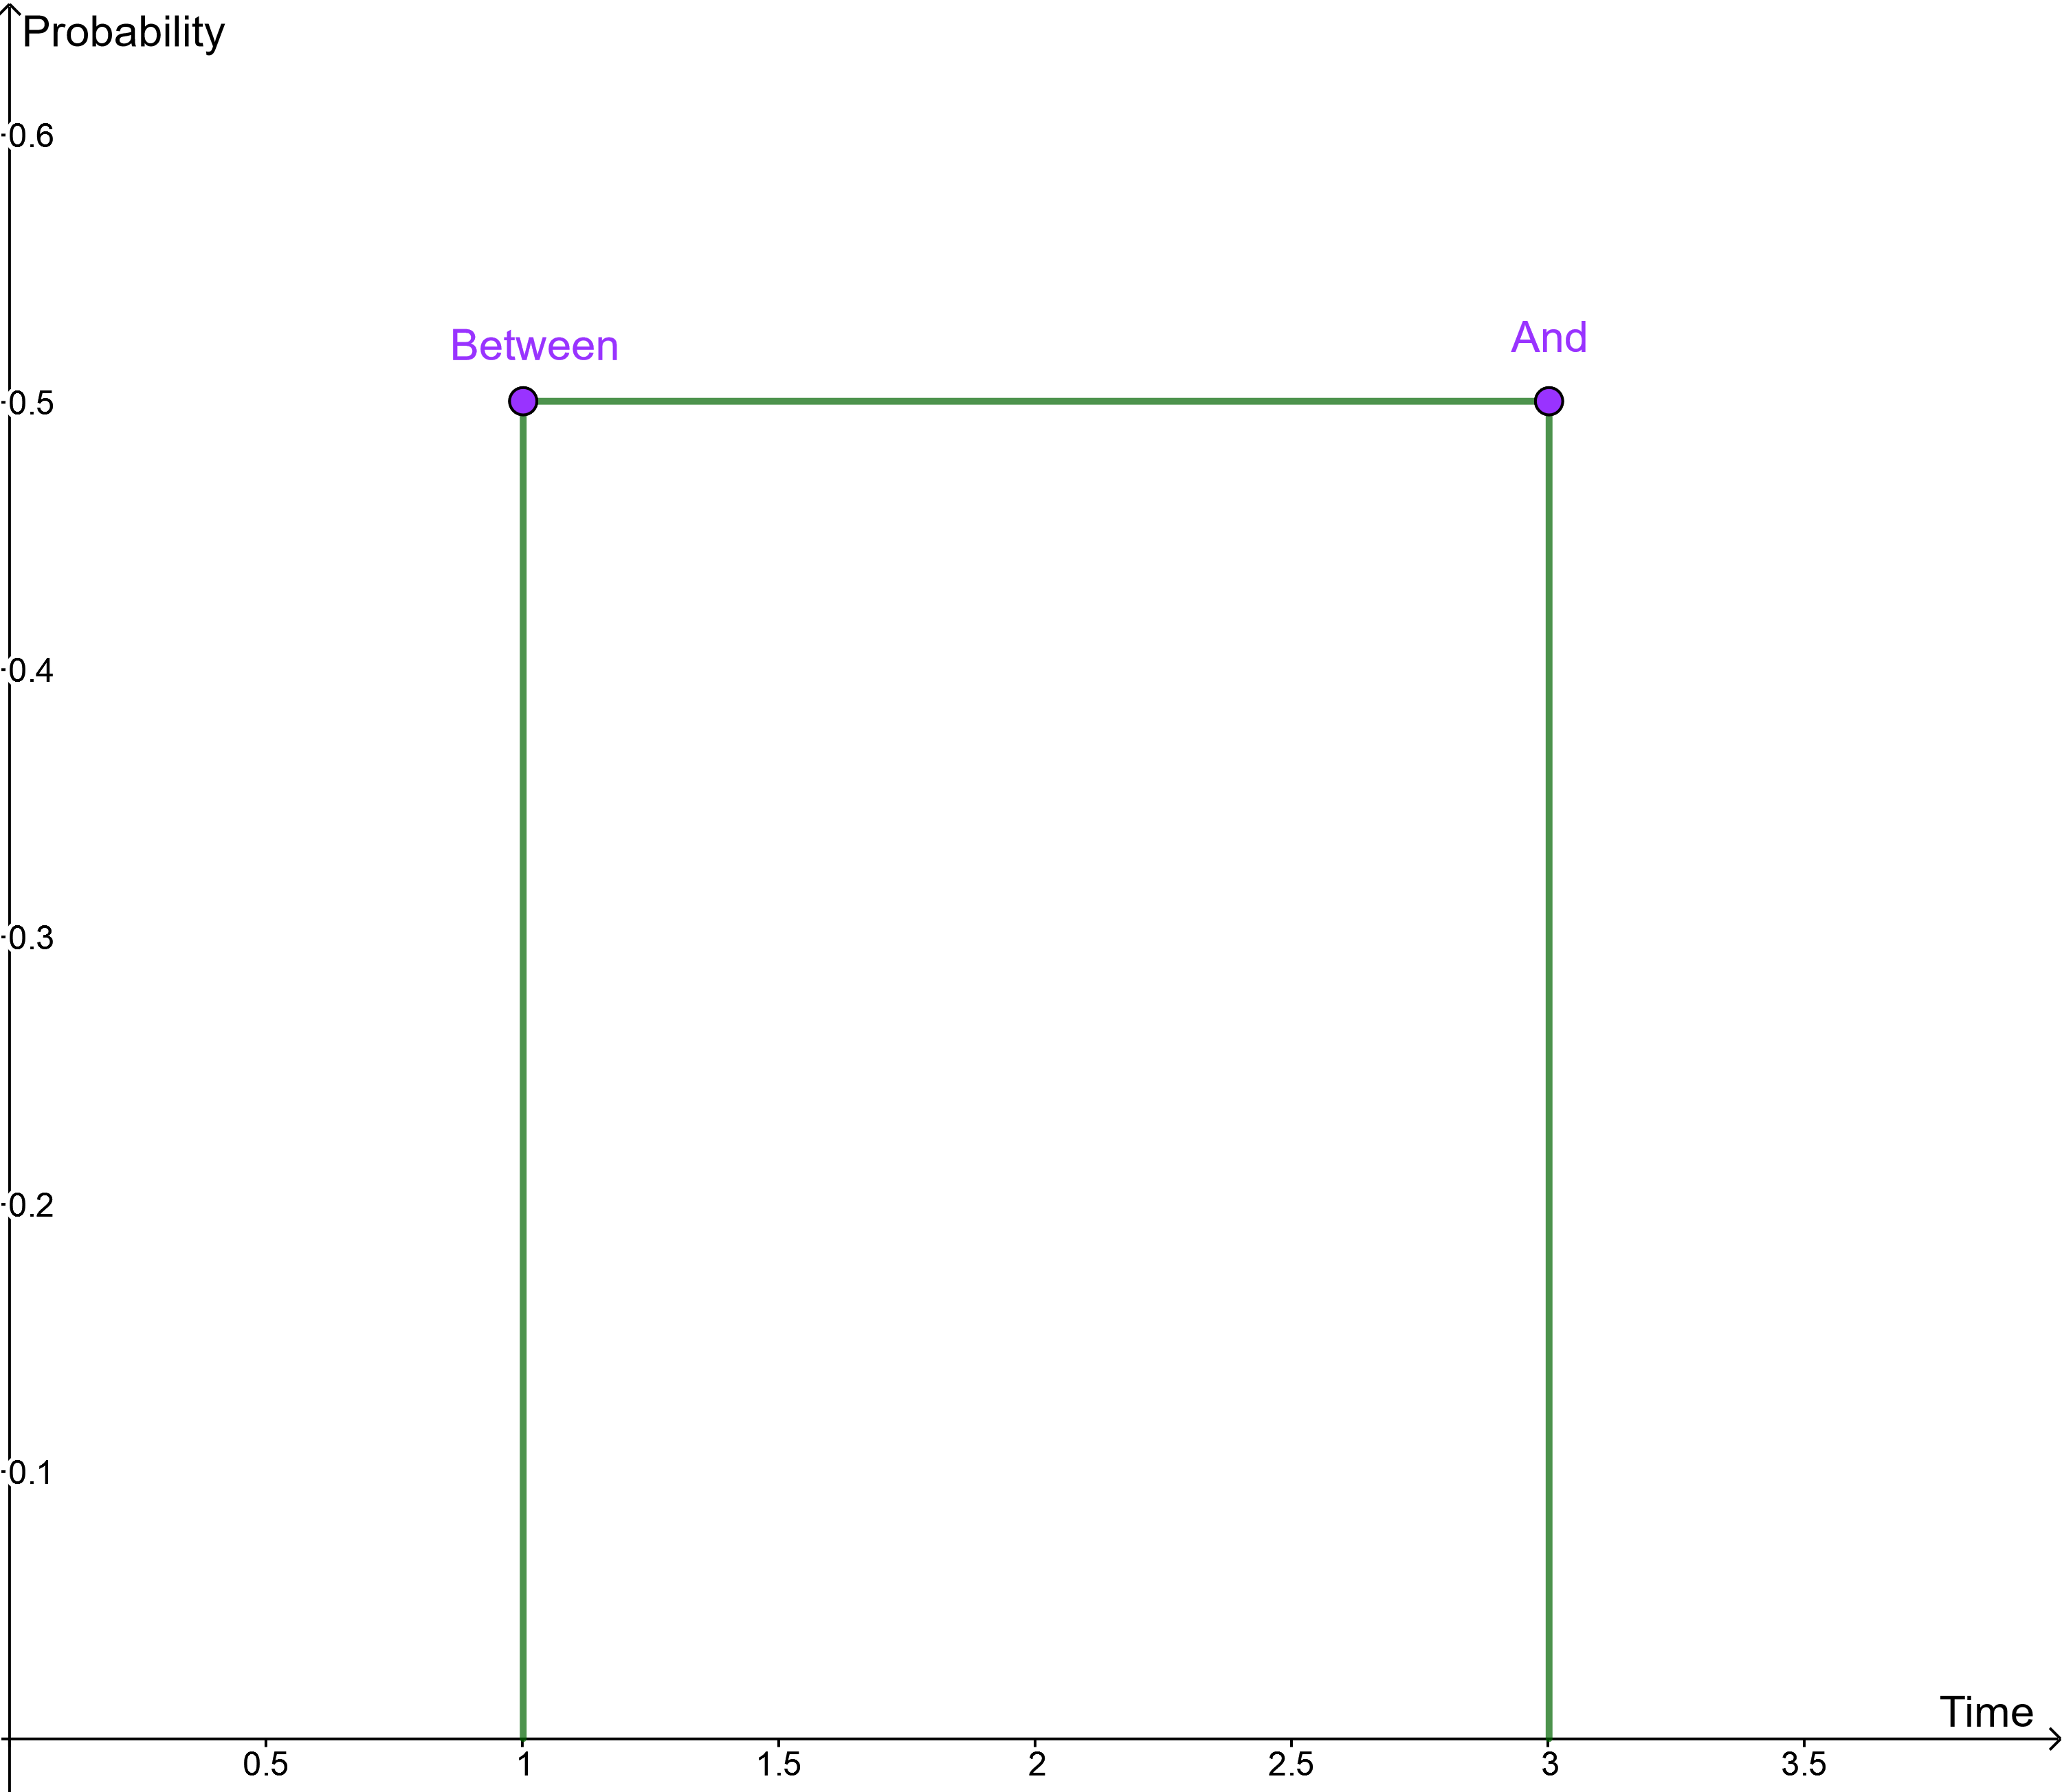
Uniform:
A uniform distribution that for every time between the given parameters the probability is the same. You need the parameters Between and And that indicate the time interval you want to use.
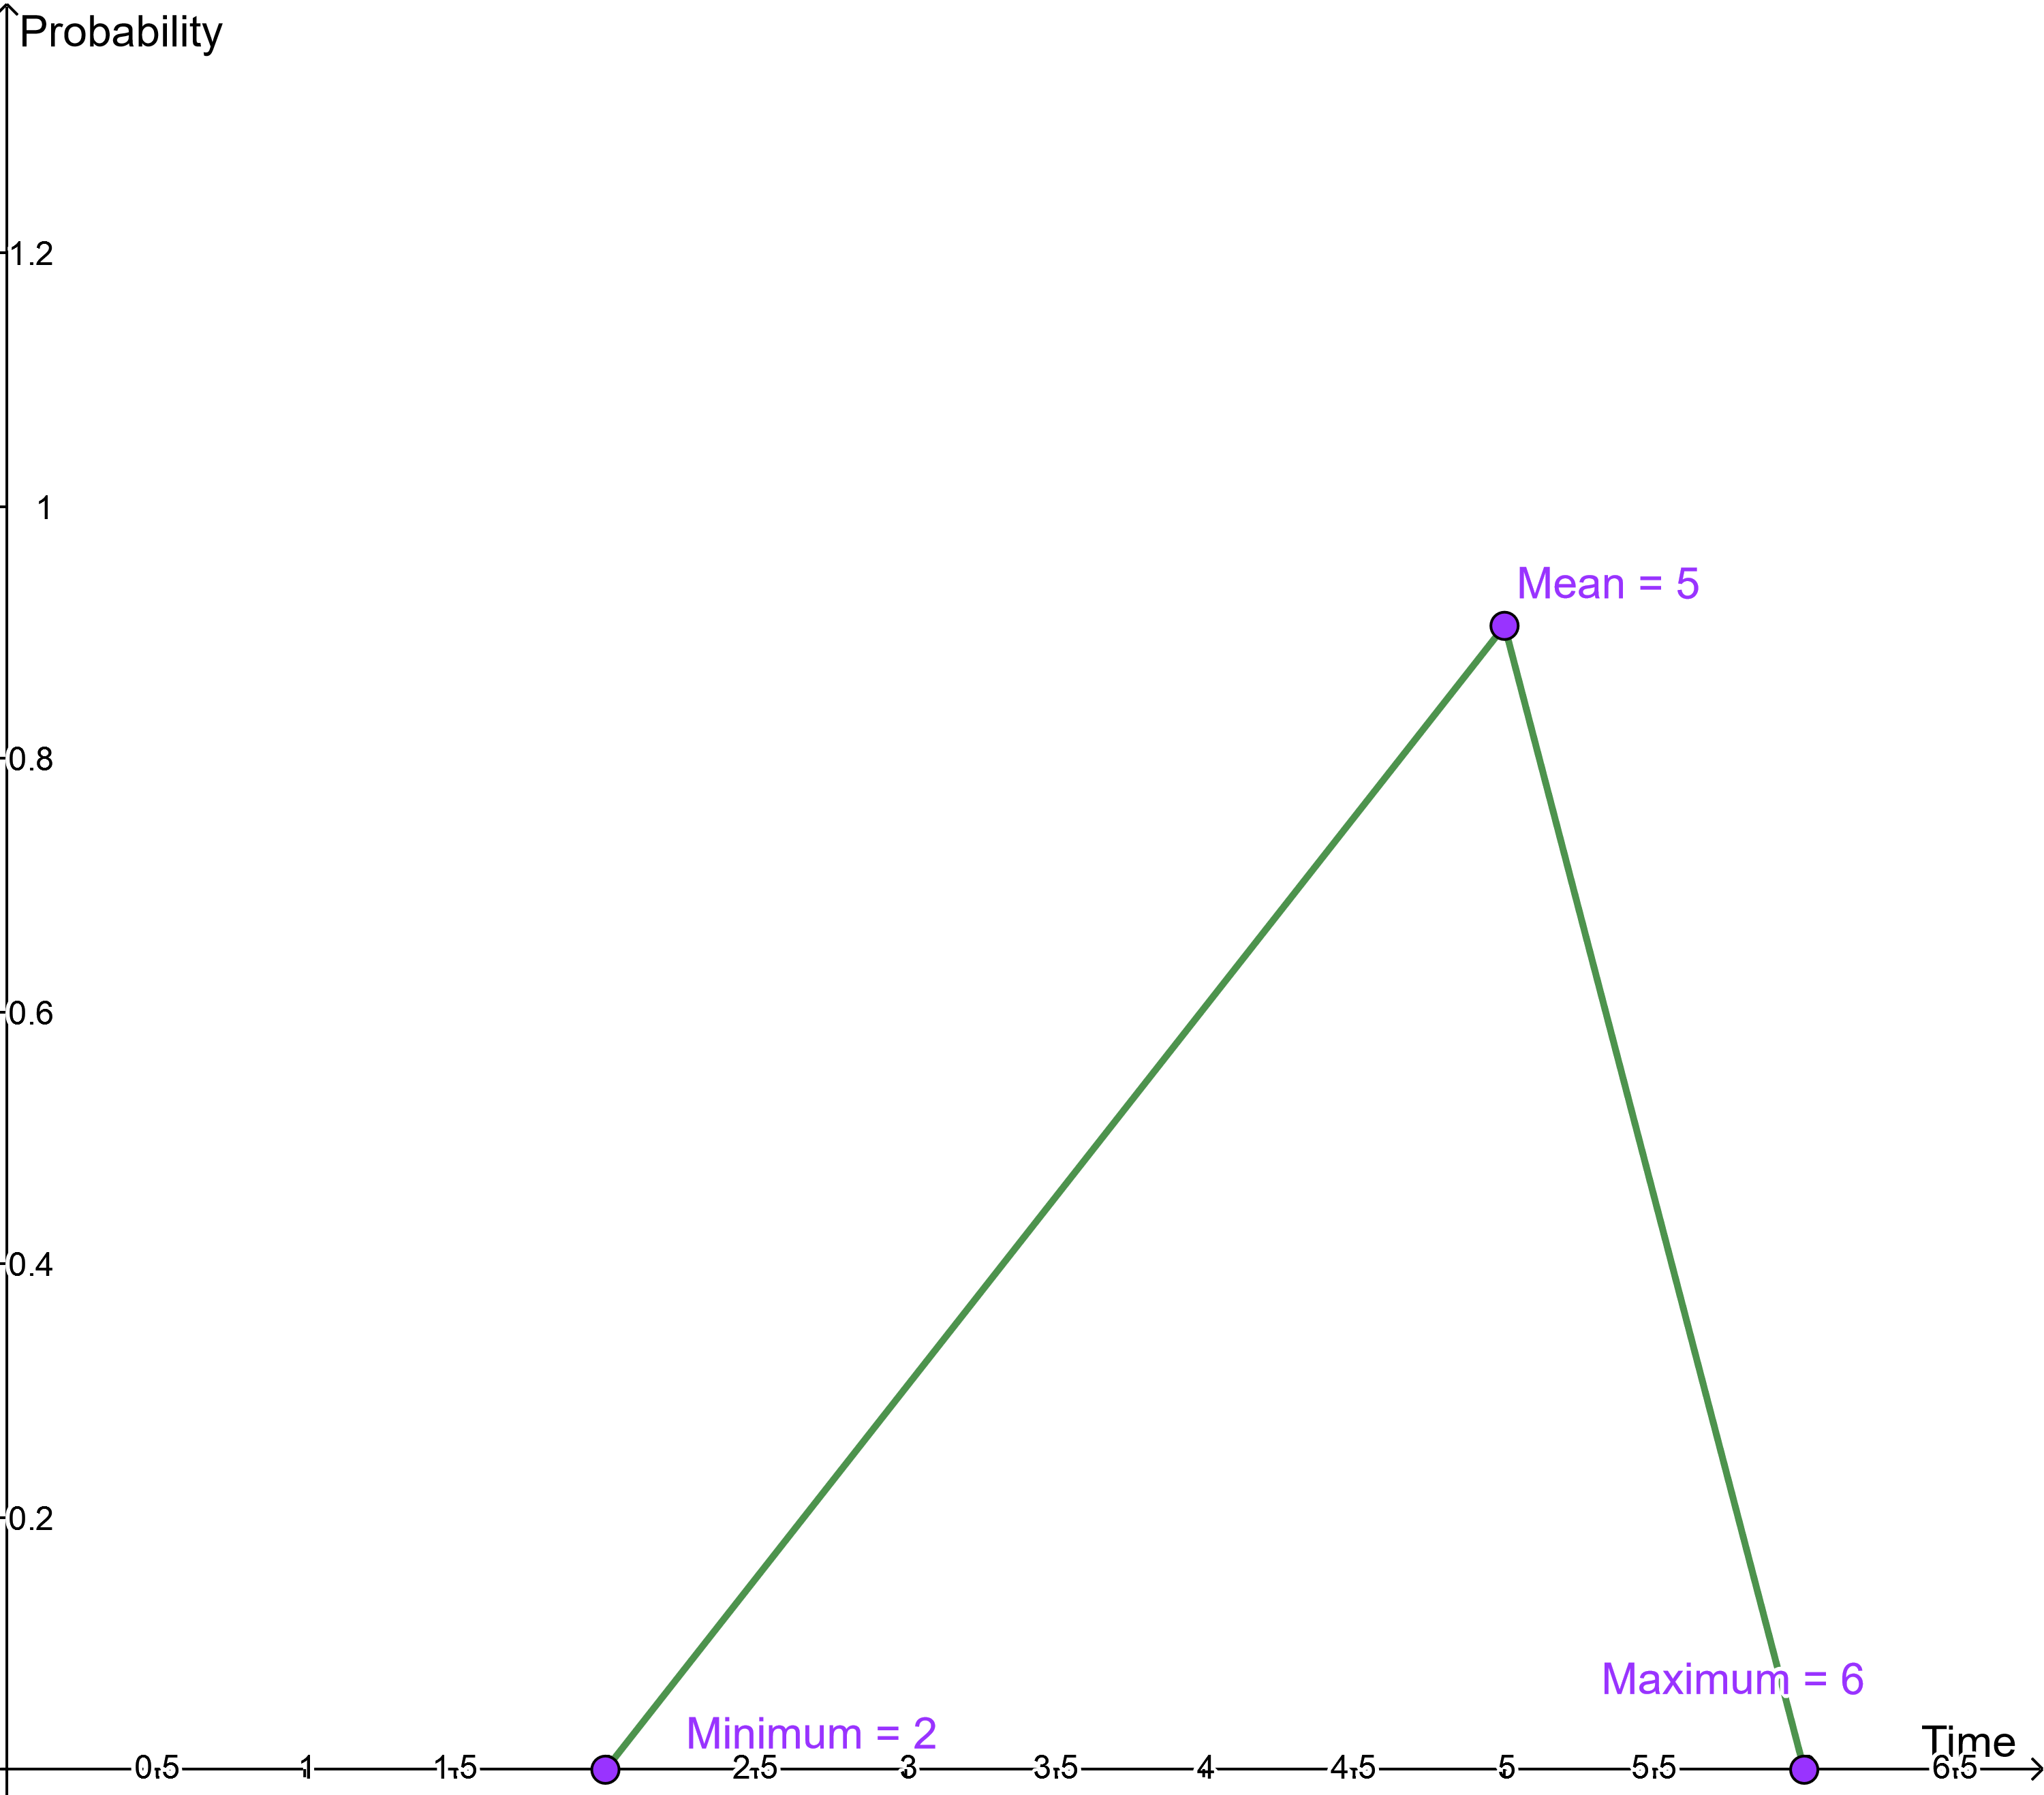
Triangular:
With the help of the triangular function it is modeled in a simplified way, after which time an event occurs at the earliest and at which time at the latest. Therefore you need a Minimum (a), a Maximum (b) time and a Mode (c).
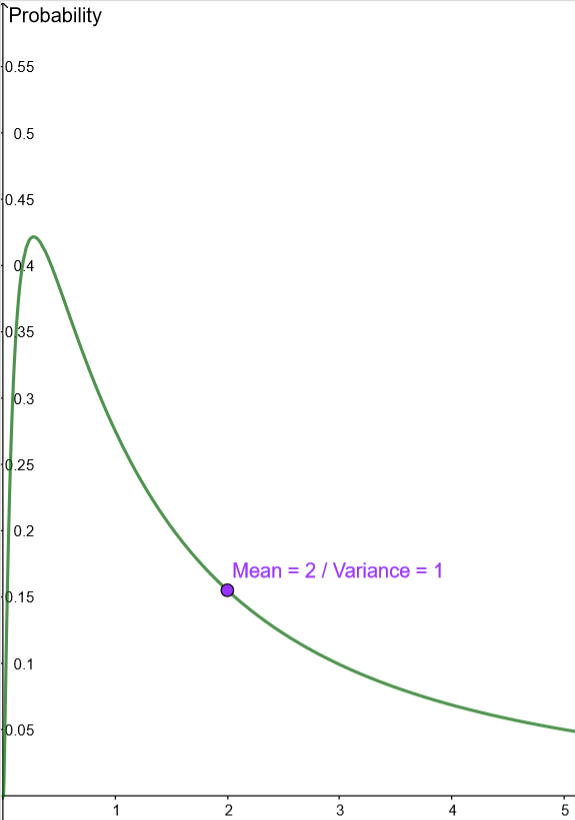
Log Normal:
The log normal distribution is relatively similar to the exponential distribution. Which of the two makes more sense in the particular case depends on the expected or measured data. The log normal distribution needs also two parameters Mean and Variance.
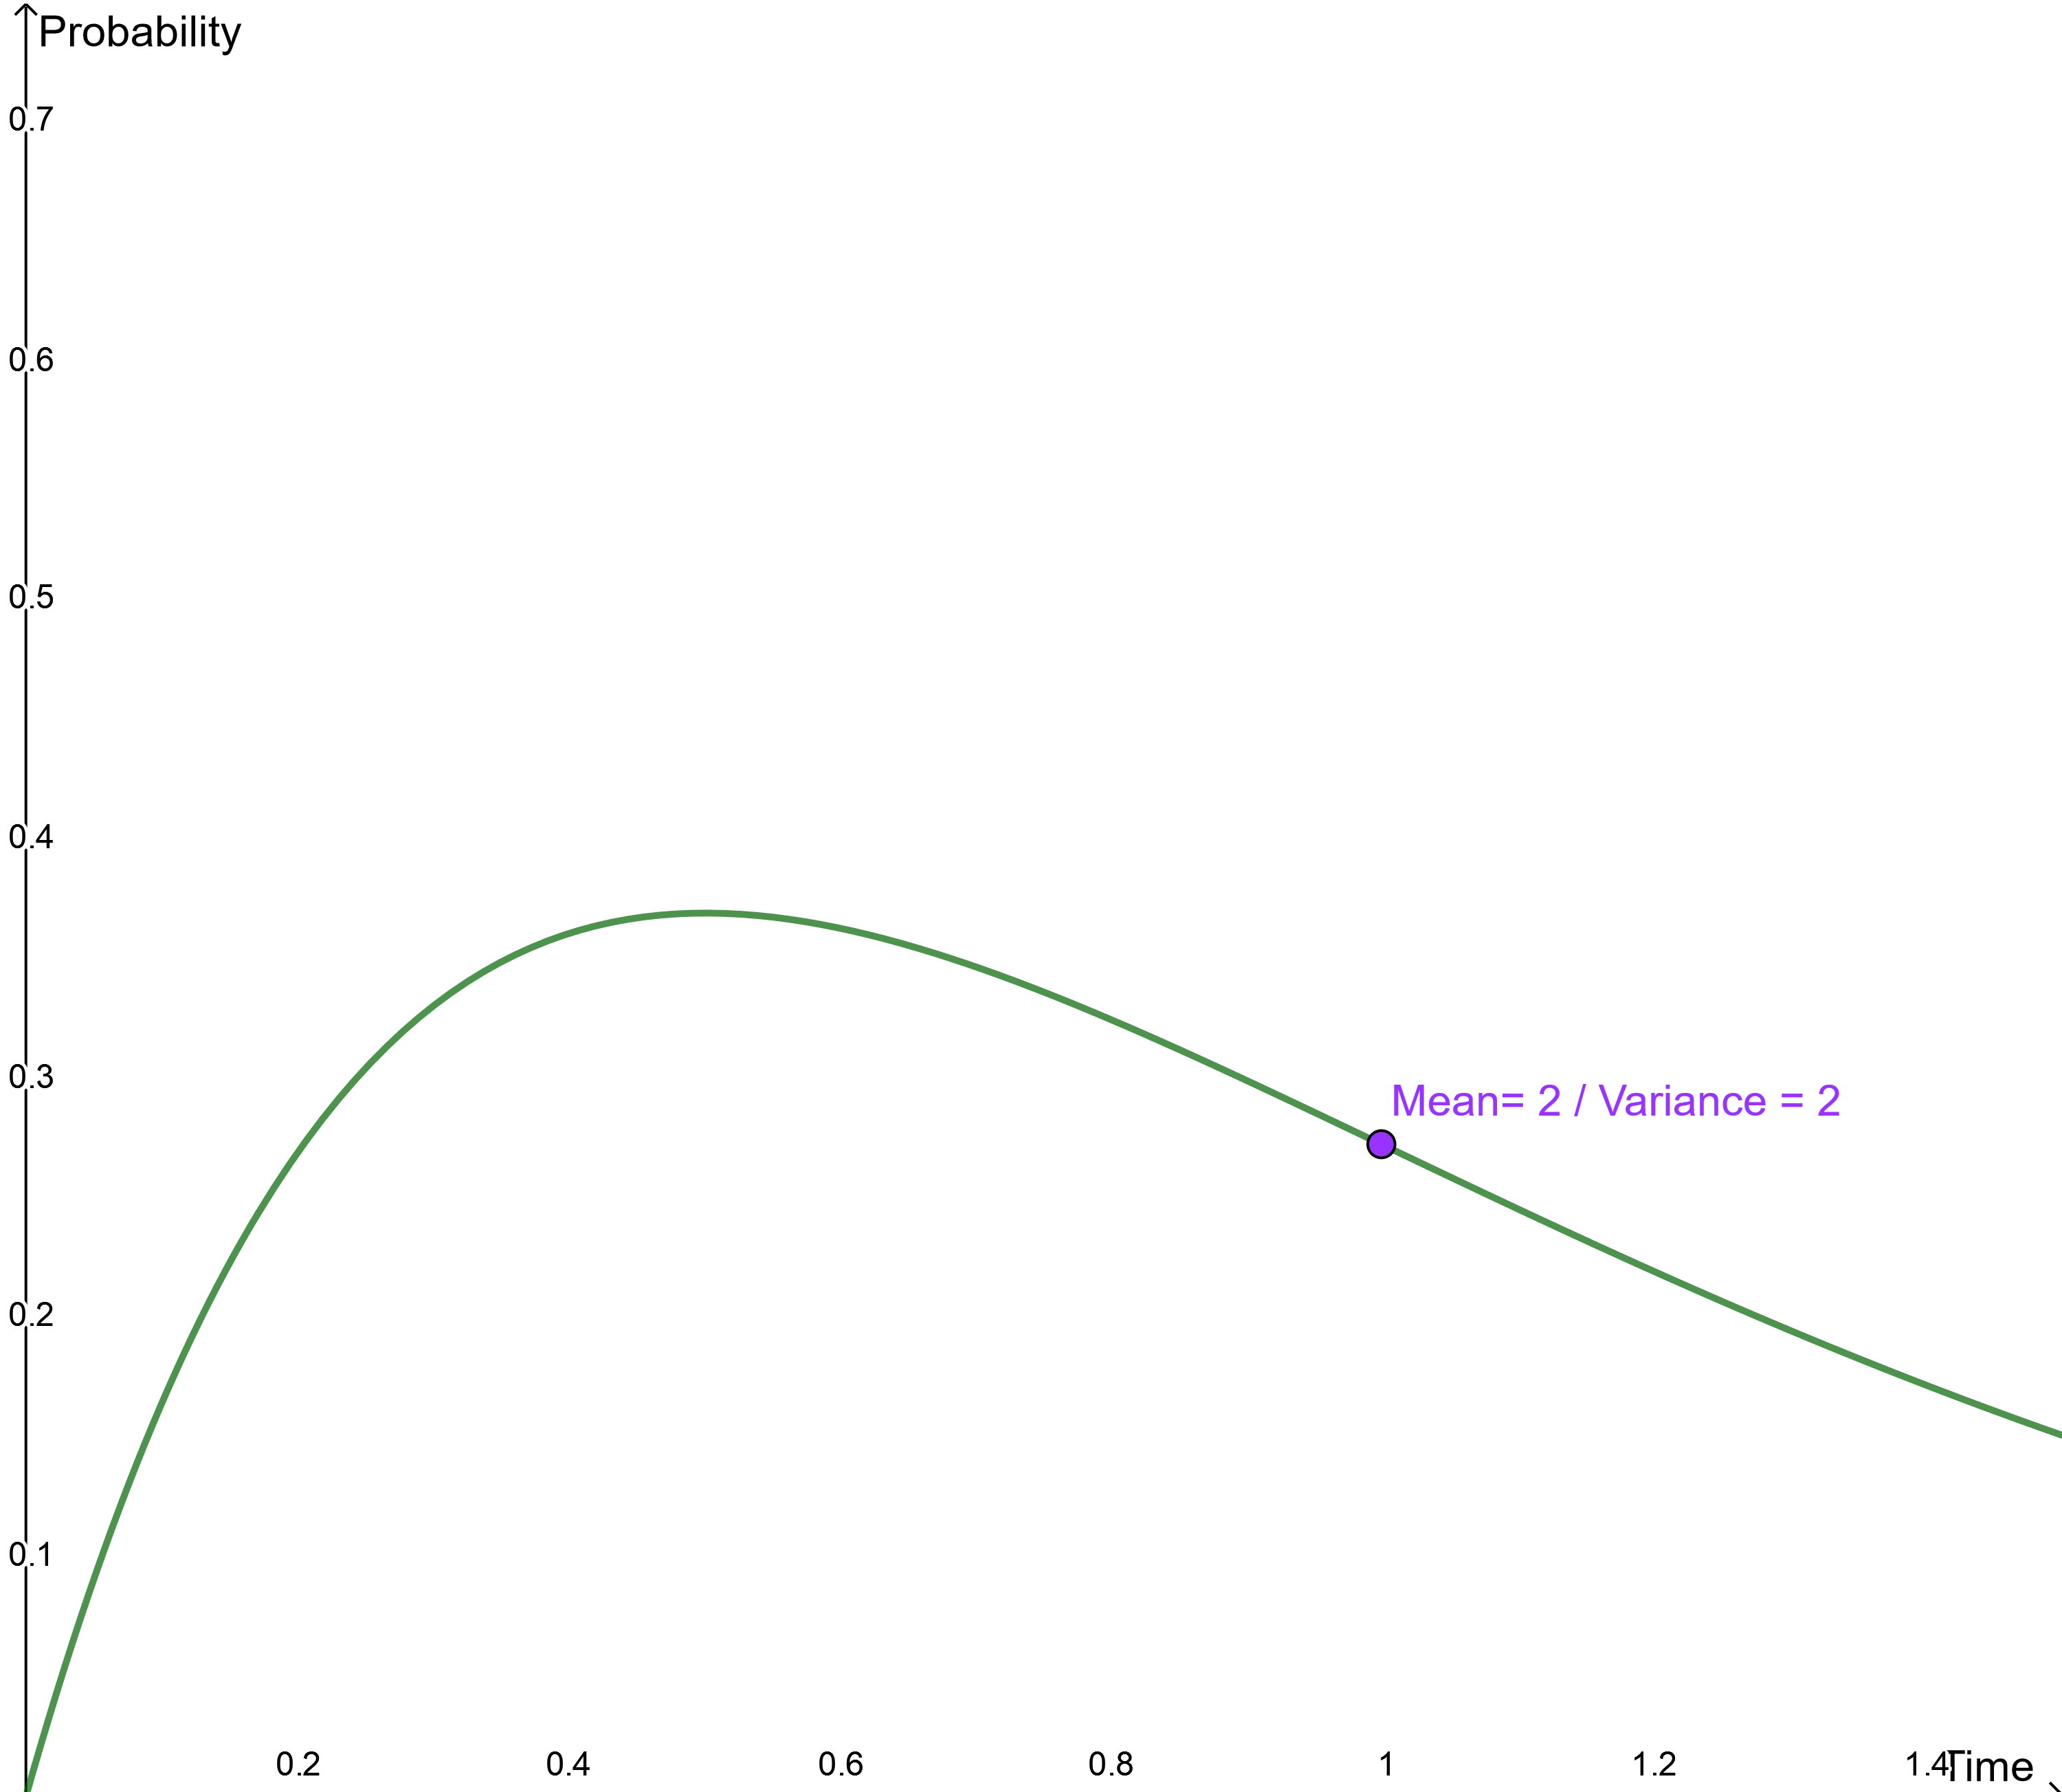
Gamma:
This distribution function enables a realistic simulation of a queue, a lifetime of a product or a repair time. For this, the input parameters Mean and Variance are required.
Which results do I get from the simulation of a scenario?
If you have requested a simulation for a scenario, you will get a numerical evaluation in the sidebar and a heatmap in your diagram. More information about the heatmap can be found in the linked section. The results in the sidebar include the following two parts:
General information
The KPIs of the scenario will be provided here. The total costs, the number of completed process instances and the elapsed time for the whole scenario will be displayed so you can estimate the duration and cost of the process.
Scenario statistics
These statistics break down the costs of the process instances. There is a maximal, minimal and average value for the time and cost needed to execute the process in the scenario once. The Process waiting times show the time that a process instance is on hold in the scenario. The waiting time includes all time spans that are measured when a process step cannot be executed yet.
A click on the button Back to options redirects you to the options of the diagram view.
Warning
If you leave the page or the scenario, the simulation results is not saved. The specification of the scenario is only saved if you go back to the options list. If you like to see the results of this scenario, you have calculate them again.
What information is contained in the heatmap?
If you requested the simulation of a scenario, the diagram will be colored as a heatmap showing the Waiting times of each process step.
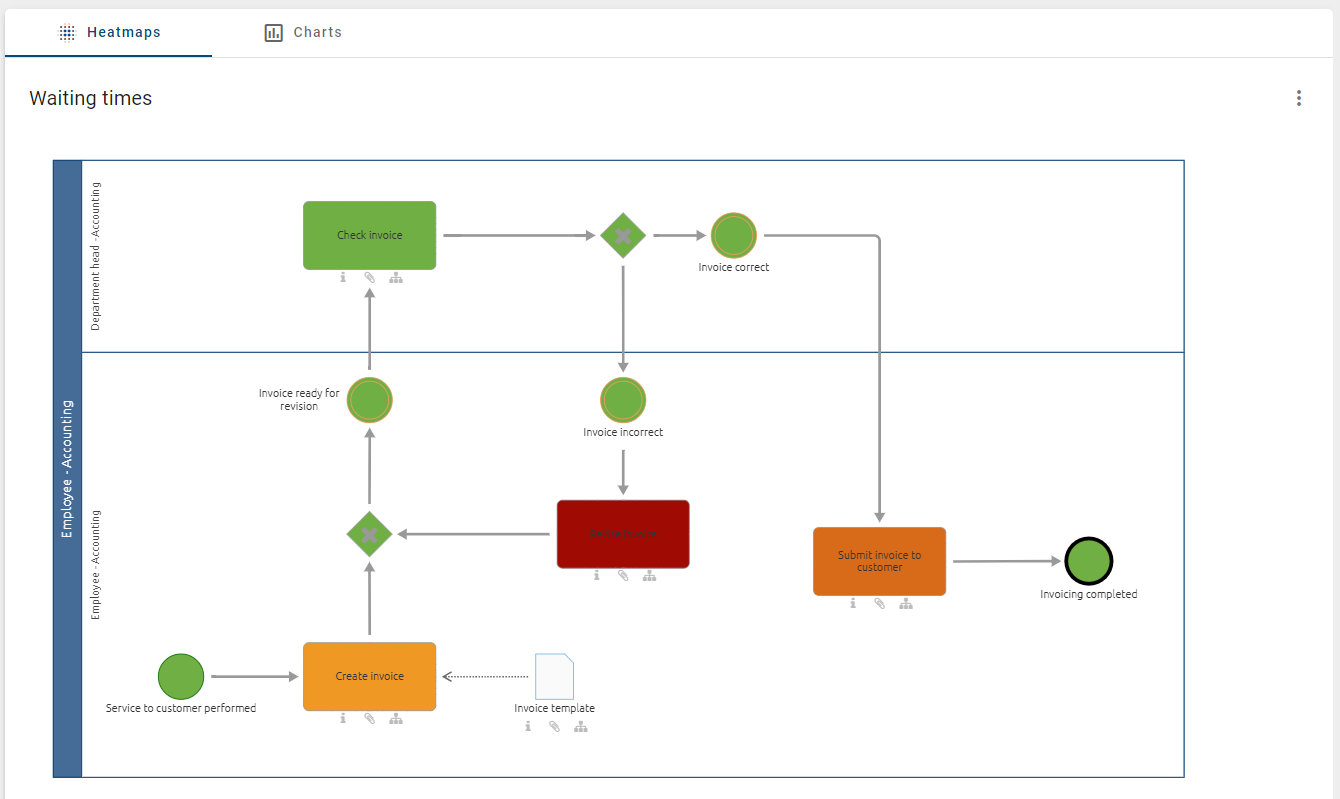
You can choose to view the heatmap for other KPIs in the context menu which is accessible via the three dots in the upper right corner. All views support you to analyze your process concerning the need for optimization.
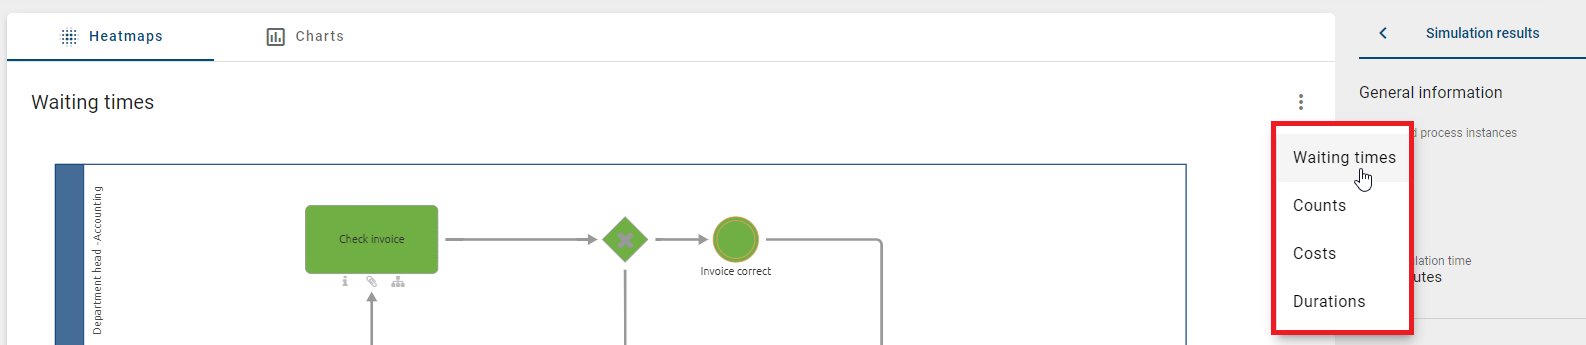
Waiting times The waiting time is the average time it takes for each process step (i.e. activity/task) to be started. It occurs when an activity has to wait for a free resource. Therefore, the heatmap displays where there is a delay in your process.
Duration: The heatmap shows the average duration of each process step during the simulation.
Costs: You can examine the costs that each process step caused on average during the simulation.
Counts: The values indicate how often a process step has been executed when the demanded number of instances was simulated. If the process flow is dynamic (i.e. includes gateways), this map provides information about the frequency that the different paths have been executed.
The following color scale shows the spectrum of the heatmap. The green color corresponds to relatively low values and the red color corresponds to the highest values.

If you hover over an element of the diagram, a pop-up appears which shows the KPI of this elements depending on the currently chosen heatmap. For the waiting time as well as the duration and cost, the average, minimal and maximal value measured for the process step are displayed. Moreover, in the heatmap based on counts, the value directly indicates how often a process step has been executed during the simulation of all instances.
What information is contained in the charts?
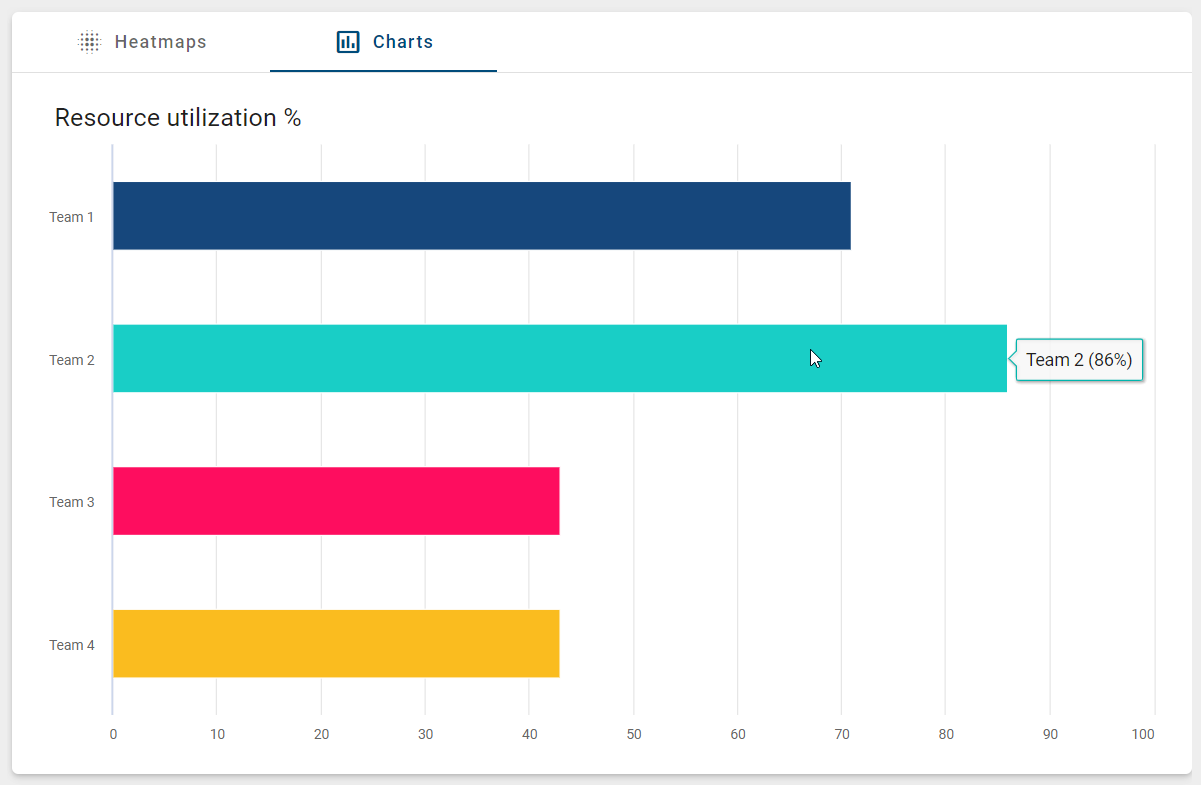
In addition to the Waiting times in the Heatmap view, you have the option of displaying the Resource utilization in % in a bar chart. To do this, move to the Charts tab.

A vertical bar chart will appear with the resource names and the utilization rate in percentage, with an interval from 0 to 100 %. To get the exact percentage of utilization of a resource, you can hover over the corresponding bar.
How can I download simulation results?
The simulation results can be downloaded as a CSV file via the Download results (CSV) button. Select the Download icon next to Simulation results after the simulation has been run.
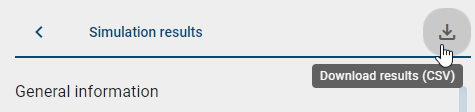
The downloaded CSV file is named with the timestamp of the simulation run.
Note
The download option for the CSV file is not available for small screen sizes (e.g., in the mobile view)