Modeling
First steps
The modeling of a diagram is done in the new design interface.
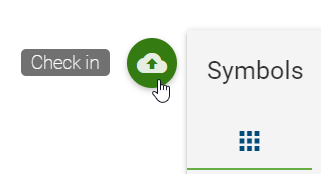
You can check out your diagram to edit it. It is then locked for other users. After completing the editing, you have to check in the diagram again, so that other users can see the changes and continue to work on the diagram.
The design surface
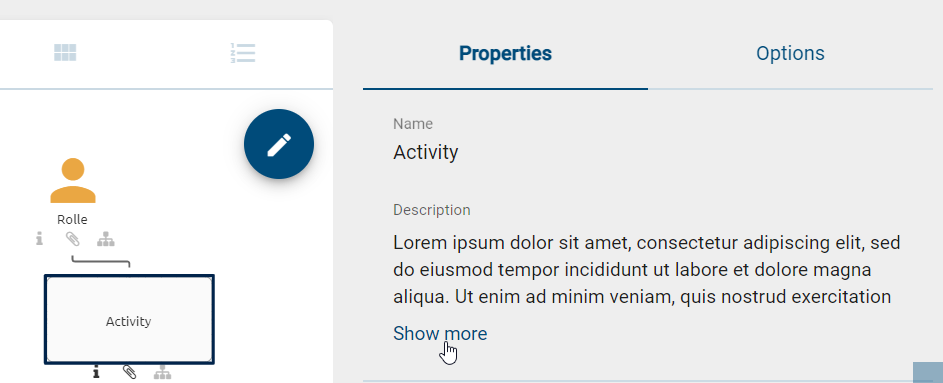
The screen of the designer provides different functionalities and is divided into four areas.
Explorer: In the header you can see the Explorer in which your repository and the category containing the checked-out diagram is displayed.
Editor: The Editor represents your working area in which you can model and edit your diagrams as well as the necessary symbol palette.
Details and Options: This area allows you to edit the details of the diagram and validate the diagram.
Menu bar: On the left side of your screen you will see the menu bar, which allows you to navigate to other areas of the application.

Figure: The surface of BIC Process Design is divided into Explorer (1), Editor (2), Details and Options (3), and Menu bar (4).
How do I edit/check out diagrams?
Authorized users (Administrators, Editors and assigned Authors) can access the new design interface in diagrams in the public workspace. If you open your diagram in diagram view and no other user has currently checked it out, the Check out button appears in the upper right corner.
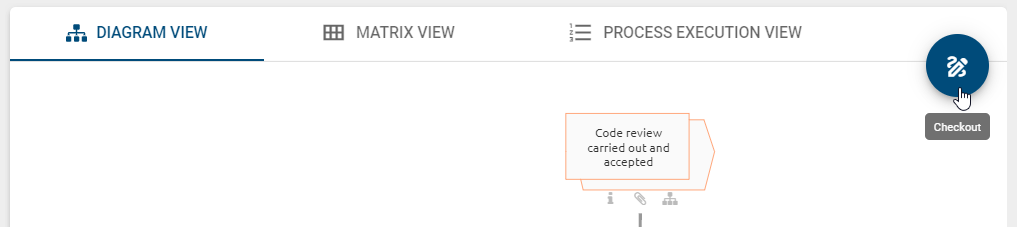
A click on the Check out button opens the editor, whereas the diagram is locked for other users. This prevents the parallel editing of one diagram by different users. If you checked out the diagram before, a button to enter the edit mode is displayed which opens the diagram editor again.
If the diagram has already been checked out by another user, a lock icon will appear instead of the Check out button.

To find out which user has locked a diagram, move the mouse over the lock icon. In the following chapter, you will find more information about possible actions you can take for locked diagrams.
How can I work with locked diagrams?
As a user with the Administrator role, open the Diagrams menu item in the left menu bar and first select a diagram from the list. After making your selection, you will automatically be redirected to the diagram view. There, you have the option to check out a diagram. However, some diagrams cannot be edited directly because they are locked.
If the diagram is locked, a lock icon will be displayed instead of the Check out button. When you click the lock, a selection menu with two different options will open. To unlock the locked diagram and be able to edit it, click the Unlock diagram option.
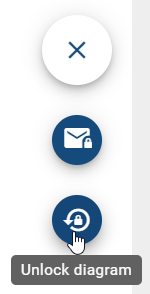
A dialog will open where you have to confirm the process with Unlock. The diagram can now be edited from the last saved version.
Warning
If you unlock the diagram while it is locked, the locking user will no longer be able to check in their local work status. To avoid unintentional data loss, contact the locking user first. Unlocking cannot be undone.
In addition to unlocking, you also have the option of contacting the locking user directly by email. Clicking on the Contact [email] option will open your local email program with the locking user’s email address already entered in the recipient field and the diagram name in the subject line.

Note
If you have checked out a diagram and then work offline, you can continue editing it. As long as you do not close or refresh the browser tab, you can save and check in your locally made changes once the internet connection is restored.
Hint
Please note that if you click on a locked diagram with the Editor user role, you will only be shown the option to contact the user who locked it.
After a locked diagram has been unlocked and the latest version has been restored from the server, a dialog with the Diagram has been unlocked message will appear for the user who previously locked it as soon as they click on the diagram after it has been unlocked. This dialog provides information about the required next steps.
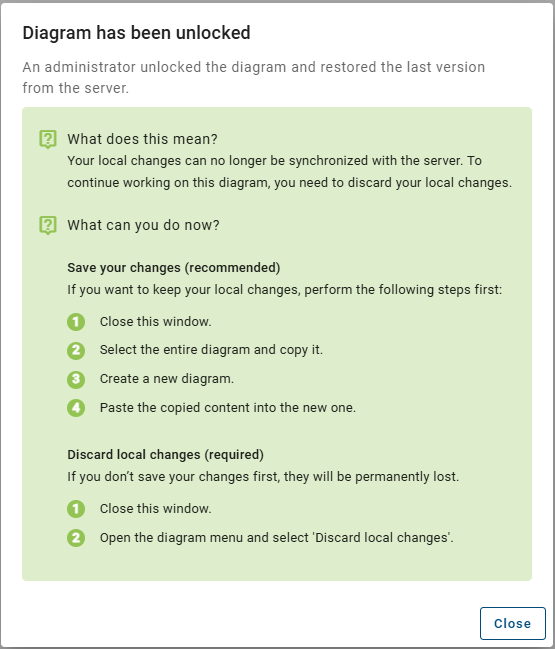
Once you click the Close button, please follow the instructions displayed in the dialog. To continue working with the diagram, you must discard the local changes via the Discard local changes option in the Options panel in the right sidebar.
How do I save changes?
The user can save the editing of a diagram, but the changes are not yet available for other modellers. They are stored in the “Local Storage” of the used browser.
By checking in, the current state is being transferred to the BIC Process Design server and is visible in the public workspace. The diagram is released now so that other authorized users can edit it.
Warning
According to your browser settings, local workstations may be discarded when the browser is closed or by clearing browser data. Regular check-in is therefore highly recommended.
Hint
If OCL rules of the severity blocker (that are defined in the current method) are violated by the modeling, it is not possible to check-in the diagram. Moreover, the check-in is prevented if not catalog suggestions are used in the diagram. Further information can be found in the linked sections.
How do I cancel the editing of diagrams without saving?
If you changed a diagram, but you do not want to check in these changes and transfer them to the local workspace, you have the following option to discard the changes:
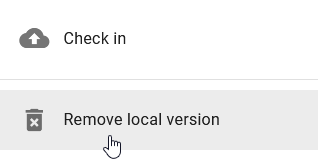
Open the options for the corresponding diagram and select the entry Discard local changes. Confirm the subsequent query to irrevocably delete your changes. The diagram is now unlocked to other users.
If a checked-out diagram is exited in the editor without Saving, a dialog appears as a warning. You can click Cancel to continue editing or Discard and leave to discard unsaved changes. When you discard your changes, the diagram is automatically checked in and is no longer locked for other users.
Where can I find help while modeling?
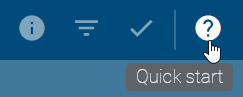
Click on the question mark in the menu bar, and then click on the Help tile. This will open the user documentation in a new browser tab. Then navigate to the Modeling chapter.
Objects
How do I add objects to a diagram?
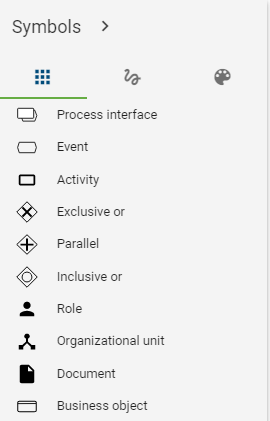
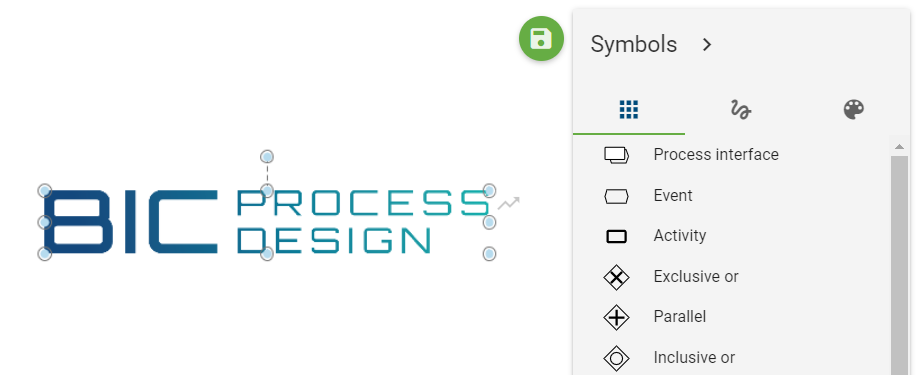
Symbol palette
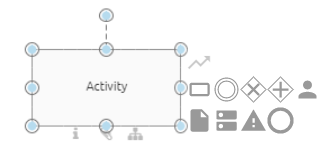
Objects can only be modeled in checked out diagrams. The symbols available for modeling vary for each diagram type. When you check out your diagram, you will see the symbol palette as the first item on the upper left corner of the editor. It contains all the symbols allowed for the respective diagram type.
You have several options to place symbols from the symbol palette into the editor.
Drag & drop: Select a symbol that you want to place in your model and drag & drop it into the editor. After placement, the text field of the symbol is automatically selected so that the symbol can be named individually. Also note the rename section when naming. Repeat this step for all desired symbols.
Stamp mode: You can use the stamp mode (the corresponding symbol is highlighted in the symbol palette), where you can create additional symbols of the same type. Select a symbol with a single click and place it by clicking into the editor. You can exit the stamp mode by pressing the ESC key or by clicking on the symbol in the symbol palette again.
Mini symbol palette
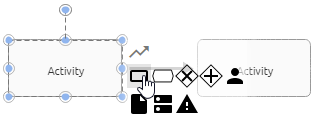
As an alternative to modeling with the symbol palette, it is recommended to use the mini symbol palette which displays all objects that can be connected to your current symbol.
Place or select a symbol in the editor. On the right side of the symbol, some symbols will appear, that can be connected to the selected symbol.
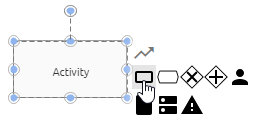
A connection between two symbols will be automatically created by placing a new symbol. The following options are now available. Also note the possible shortcuts.
Drag & drop: Select one of the symbols and place it in the editor while pressing the mouse button.
To ensure that the same distance is modelled between at least three symbols, you have the option of activating the function with the ALT key. An indicator is displayed that visualises the same distance. You can deactivate the function again at any time by pressing the ALT key.
Releasing the mouse button creates the symbol including the connection.
Quick Modeler: If the user simply clicks on an item in the mini symbol palette (no drag), a new object will be created immediately. The new node is placed centered at the same distance from the predecessor to the last symbol. The direction depends on the predecessor, because the new node is placed on the opposite side of the predecessor. If there is no predecessor, then to the right of the node and at a preset distance.
You can create multiple descendants for a node.
These are automatically created among each other using the Quick Modeler. Since the connection is centered, which means at the center port in the middle of the icon, it may overlap other symbols.
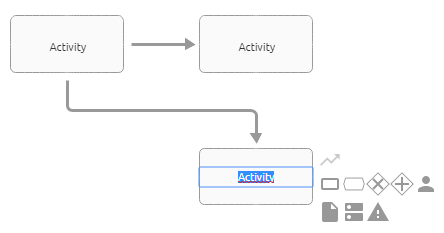
You can then reposition connections. Successors of successors are modeled either one below the other or one after the other, depending on the maximum distance to the predecessor in the x- and y-direction of the editor. By changing the position of the symbols you can adjust the behavior of the Quick Modeler.
The text field of the new symbol is selected so that it can be named individually. Also note the rename chapter.
Hint
Please note that the same distance information only appears if the symbol is dragged out of the editor. If the symbol is dragged directly from the symbol palette, the distance information is not displayed. The symbol must be placed on the editor first.
Note
Depending on the symbol and the method, a selection menu for the automatically created edge may appear after placement from the mini symbol palette. To create the symbol, a selection must be made in this menu.
How do I create forms and graphical symbols?
Navigate to the free form symbols by selecting the second button in the editor.
Select a free form icon from the list and place it in the editor.
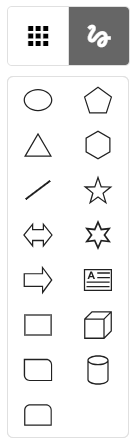
For example, the following free form symbols are available: rectangles, ellipses, text fields, triangles, cubes, arrows, and more. You can label free form symbols using the multilingual text field. Alternatively, after selecting a symbol, you can trigger the input field by double-clicking or pressing the F2 key. Additionally, free form symbols come with various attributes. You can search for these objects, enable catalog suggestions, and configure these settings through the free form object in the administration area of BIC Process Design. The line symbol is an exception, as it does not have these properties.
How do I move an object?
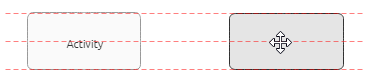
You can reposition an object by drag & drop. To do this, select the object with the left mouse button and keep it pressed while you navigate the mouse to the desired position. The object moves with your mouse. If the desired position is outside the current diagram section, you can also move the diagram view field by pressing the right mouse button or using the scroll wheel while holding the object with your left mouse button. When you release the left mouse button, your object is placed at the mouse position.
Optionally, you can use the arrow keys on your keyboard to move the object in all directions.
Note
You can also move a multi-selection of objects using this procedure.
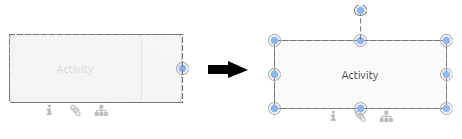
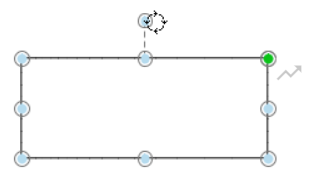
How do I change the size of an object?
Select the object you want to change with a single click.
Press the left mouse button to alter the size of the object by using the blue points along the edge. Release the mouse at the desired position.
How can I switch the symbol of an object?
Within the modeling process of your diagram you have the possibility to change the symbol of an already modelled object. This can help you to dynamically change the view on single elements in your diagram according to your needs.
To change the symbol of an object within your diagram proceed as follows:
Right click on the symbol you want to change within the checked out diagram. The context menu for the object appears.
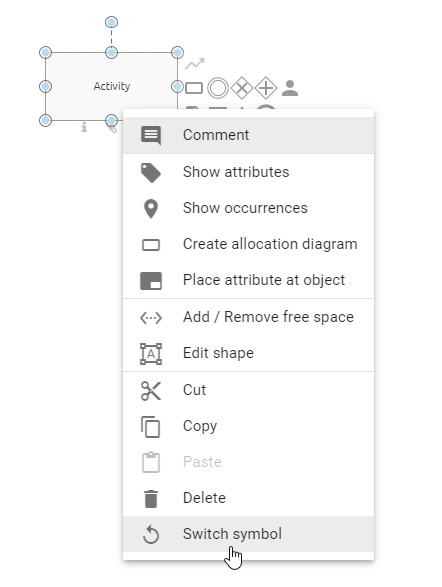
Select the entry Switch symbol. You will get a list of all symbol types, which are allowed for the given diagram type.
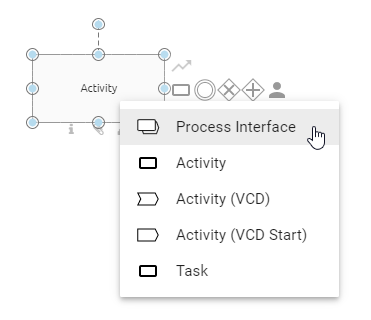
After you have selected the desired symbol type, it will be displayed in your diagram.
Symbols of container objects, such as pools, cannot be changed as soon as the object concerned already contains elements. In this case, the function for changing the symbol for this object is no longer available and is greyed out in the context menu.
Note
Symbols that are already part of a pool cannot be switched into the symbol type pool. By switching the symbol, placed attributes will be reset to their default. If no attributes are placed at the symbol by default, then no attribute will be placed after changing the symbol.
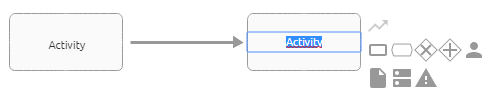
How can I label or rename objects in the editor?
Depending on the object, the writing area is either displayed directly after modeling an object or by double-clicking on the object. A suggestion list for all the catalog entries used in the diagram is displayed then. You can select a proposal with a mouse click or label the object. When labeling, you can also choose from a suggestion list with catalog items of the server that contain the entered term. Otherwise, end the entry with a single click in the editor.
Optionally select the object by clicking on it once and press F2 so that the writing area is displayed.
You can also rename symbols using the details.
Note
Note some peculiarities when renaming and editing attributes of symbols in diagrams that are catalog items.
Hint
Please note that certain symbols, such as gateways, do not have a direct label when placed in the diagram. You can add a label manually by double-clicking on the symbol after placing it.
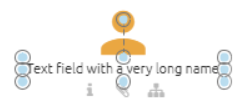
How do I change the size, line breaks and the position of text fields (labels)?
You can change the size of some text fields which contains the name of a symbol. For example, if the name is very long, you have the option to display it in two lines (by alerting the size of the label) and to shift automatic line breaks. Alternatively, you can add manual line breaks. The text field can be positioned as you like.
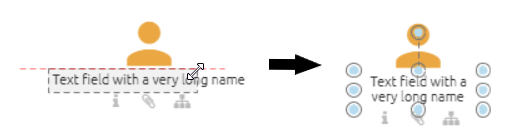
Change size
Select a text field by clicking on it.
Alter the size by using the blue points along the edge of the text field. Release the mouse button at the desired position.
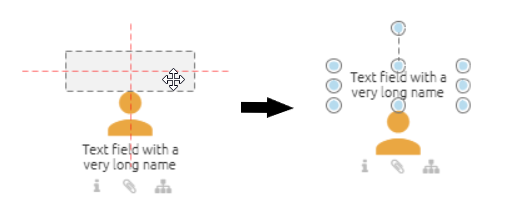
Position
Select a label by clicking on it. Then click again, keep the mouse button pressed, move the field and release the mouse button (drag & drop).
Note
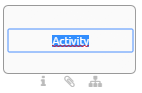
Note that the size and position of the text fields of symbols with block form, such as activities, cannot be changed. For those symbols, the label is located in the respective symbol. Furthermore, manual line breaks cannot be seen in the catalog, but are visible in the reports.
How can I place attributes at objects?
Some attributes of objects can be placed in the diagram. This includes all text attributes of the object that were maintained in the attribute bar.
Right-click on the symbol in the diagram to open the context menu and select Place attribute at object.
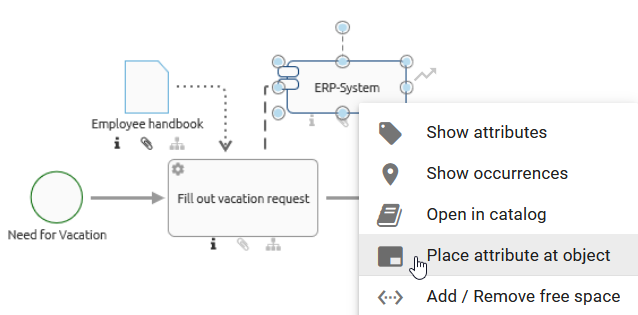
Next, select the desired attribute. All text and assignment attributes that are already maintained at the object are displayed here. If you want to select a text attribute that is not listed, you must first complete it in the attribute bar and repeat the first step.
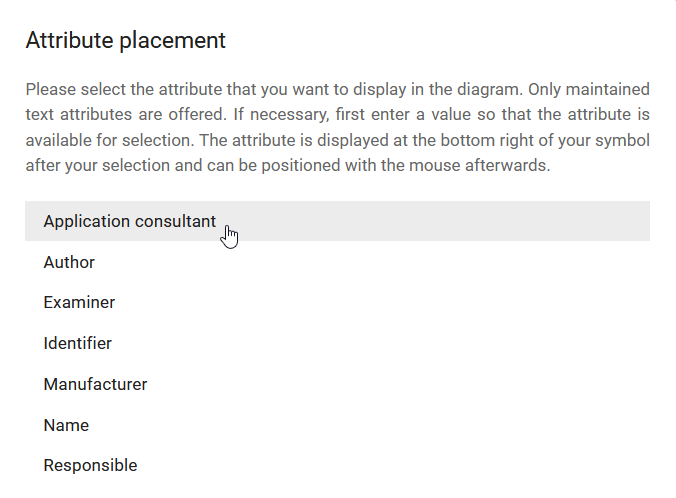
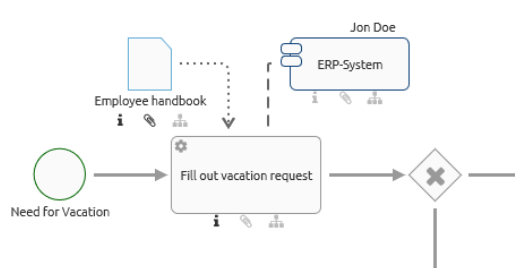
The selected attribute then appears at the bottom right of the icon. You can change the position and edit the text field by double-clicking it, if it is not an assignment. The changes are applied to the attributes of the object. The placement also gets updated, if the attributes are changed in the attribute tab. Assigned persons, organizational units and diagrams are displayed as text, with several assignments in an attribute separated by a comma.
Note
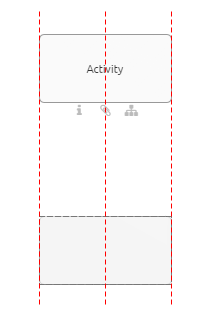
Please note that tables you have used in the description attribute cannot be displayed in the diagram. In addition, the table border of a description is not rendered on mouseover pop-up when you move the mouse pointer over the i-symbol on the activity in the diagram.
Connections
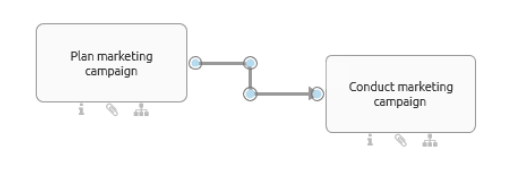
Where can I place a connection to an object?
All possible options for placing a connection are indicated with a red dot when you hold the connector with the mouse over different points of an object.
If you link objects using the outer port, the connector will stay fixed at that side of the object even when you shift it.
If you link objects using the centerport, the connector will move when you shift the object.
Connection can be added via drag & drop or by selecting the start and end ports (depending on the connection type). This is explained in the following.
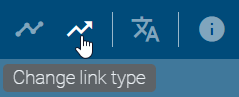
How do I change the link type?
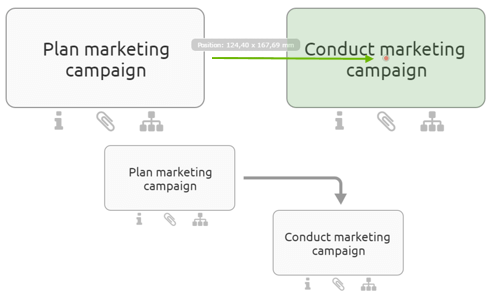
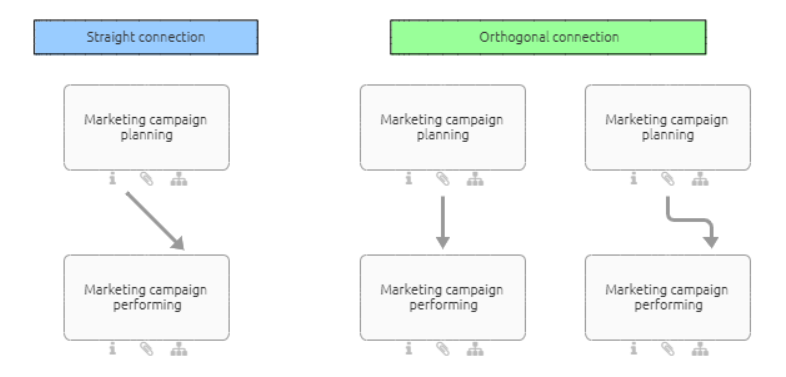
You can connect symbols using an orthogonal or diagonal connection. Orthogonal connections are horizontal or perpendicular resp. they are a combination of such lines. A connection of the type diagonal goes straight from the start to the end port without any bending. The active connection type is displayed in the editor as Change link type button. Select the button to change the type.
The symbol of the button changes accordingly: orthogonal - angled arrow, diagonal - straight arrow. If you draw a new connection between two symbols, the connection will be straight resp. orthogonal.
How can I connect symbols orthogonally?
You have the following options to add an orthogonal connection between two symbols. The connection type can be switched in the editor. If the connection type button shows an angled arrow, the connection will be orthogonal
Insert the desired two symbols into the editor or open a diagram with at least two symbols which can be linked (e.g. an event and an activity).
Connection icon
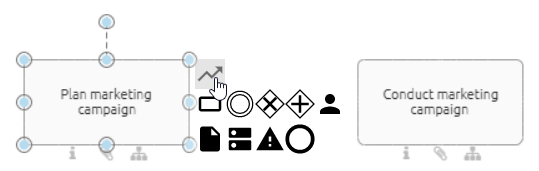
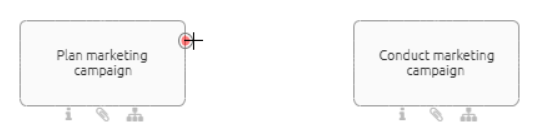
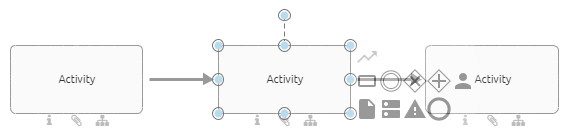
Select one of the symbols in the editor. A connection icon appears in the mini symbol palette (upper right corner next to the symbol).
Select the connection icon and afterwards a desired point at the other symbol. A sequence is added between the two symbols.
Connection Mode
If you activate the connection mode, you can add several connections. In the editor, click Activate connection mode. A red dot appears on the edge of the icon when you hold the mouse pointer over it. This dot shows the possible start points. Select the point where you like to start your connection.
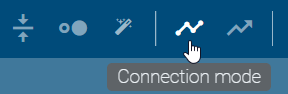
Then hold down the mouse key over the second symbol and select the location where you want to place the end of the connection. A sequence is added between the two symbols. Deselect the symbol afterwards by a click on a free space. Then you can start a new connection.
To terminate the connection mode, click on Deactivate connection mode in the editor.
Port area
Hold the mouse over the edge of a symbol for a while without clicking it. The connection mode becomes active. Now you may add a new connection as described for the connection mode. The connection mode will be deactivated automatically after you added one connection.
How can I connect symbols diagonally?
You have the following options to add an diagonal connection between two symbols. The connection type can be switched in the editor. If the connection type button shows a straight arrow, the connection will be diagonal
Insert the desired two symbols into the editor or open a diagram with at least two symbols which can be linked (e.g. an event and an activity).
Connection icon
Select one of the symbols in the editor. A connection icon appears in the mini symbol palette (upper right corner next to the symbol).
Select the connection icon and draw a connection between the current symbol and another by using the drag & drop function.
Connection Mode
In the editor, click Activate connection mode. A red dot appears on the edge of the icon when you hold the mouse pointer over it. Click on one of the symbols where you want to start the connection.
Press and hold down the mouse key and move to the second symbol. Release the mouse key at the location where you want to place the end of the connection. Then click on the Deactivate connection mode to terminate the connection mode.
Port area
Hold the mouse over the edge of a symbol for a while without clicking it. The connection mode becomes active.
Now you may add a new connection via drag & drop as described for the connection mode. The connection mode will be deactivated automatically after you added one connection.
How do I change an existing link to another link type?
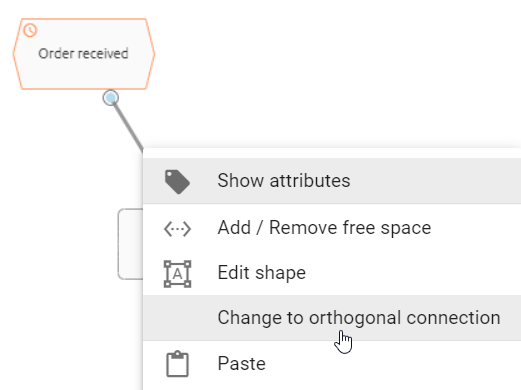
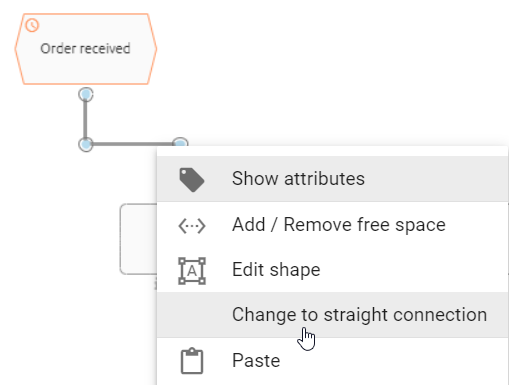
Select an existing connection between two symbols and open the context menu by right-clicking. After that select the Change to straight connection or Change to orthogonal connection entry. The connection is then changed.
How can I change an existing link?
The connection sequences are created automatically when a connection is created. You can change both its path as well as the input and output.
Select the connection you want to change.
Change path
You can move the blue points of a connection by using the drag & drop function.
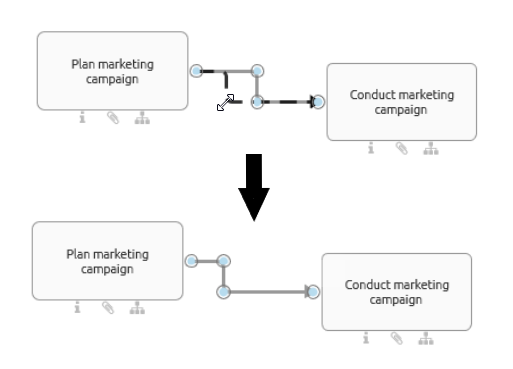
If you want to create a new nook, click on the desired location and drag a corner into the connection.
Change the port of an existing link
Use the blue points on an object to change the location of the connection on the same symbol. Simply drag & drop the existing link to another dot along the edge. Any possible inputs or outputs are indicated by red dots.
Note
Existing connections cannot be moved from one symbol to another symbol.
How can I label or rename connections?
The label is directly displayed by double-clicking on the connection. You can now label the object. Click somewhere within the editor to finish the entry.
Optionally select the connection by clicking on it once and press F2 so that the label is displayed.
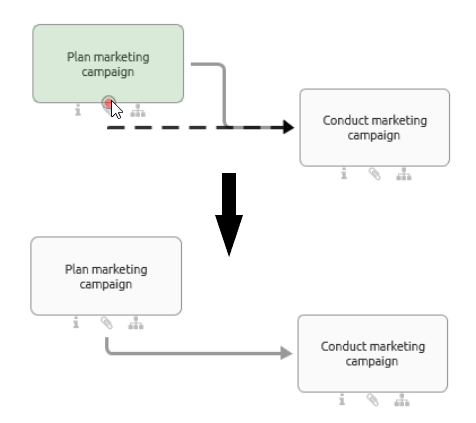
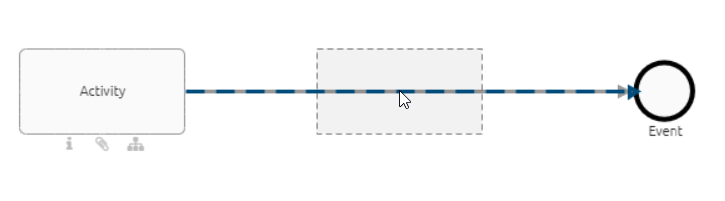
How do I insert an object into a path?
You can insert an object into an existing path using Drag & Drop. The connection between the corresponding objects has to be defined in the method.
Drag a new object from the symbol palette or a free object from the editor to the desired edge. This edge must be of the type sequence flow. When it appears blue and dashed, you can drop the object.
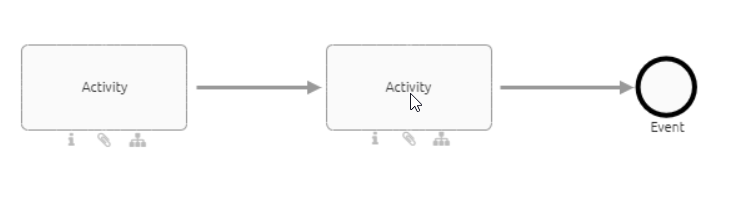
The edge is exchanged by two new edges where the new object is an intermediate node in between the two former objects. All attributes and the optional label of the old edge are copied to the newly created edge where the placed node is the target node.
If you remove the new object, the edge returns to its previous state and connects the initial two objects. In case the object types do not allow a connection, the edge does not change its layout as described above. Dropping the new object will place it on top of the edge without any connection.
Copy, paste and more functions
How do I copy and paste symbols (symbol-based)?
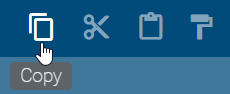
Select one or more symbols that you want to copy within a diagram or between diagrams. Then click the Copy button in the editor (alternatively CTRL+C).
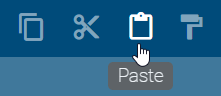
Click on the Paste button in the editor (alternatively CTRL+V).
Optionally you can right-click on an object or in the editor to open the context menu and select Copy or Paste.
You can paste objects into another diagram of different type (e.g. EPC to BPMN) if the object is available in the target diagram type. When you copy several objects, each object is checked for this requirement and pasted when applicable. If you want to paste an object which is not allowed in target diagram it will not be pasted. Furthermore, Connections will only be pasted between two pasted objects, i.e. if an object could not be pasted its connections to other objects will also not be pasted. If an object is allowed in the target diagram but the symbol of the object is not, the object will be pasted with the standard symbol. If an element could not be pasted, you will be informed about the reason for that.
Note
Copying catalog items and symbols that are not part of the catalog differs. Regardless of the object type, copies of catalog items are always reused. This means that an expression copy is created and the object remains the same. Changes to this copy will also cause changes to the original if the catalog item has not yet been accepted. Objects that are not in the catalog are doubled, a definition copy is created. Changes to the copy are thus independent of the original.
There are also differences in copying connections. A copied connection is newly created if one of the connected and also copied objects is a definition copy; this is the case if one of the objects is not a catalog item. A connection is reused if the connected objects were occurrence copies; this is the case if they are both catalog items.
Note
Please note that when copying elements, relationship attributes are not automatically taken over. This means that if you copy an activity, for example, the associated role is not automatically copied as well. Make sure that you transfer relationship attributes separately if this is necessary.
Users with the Administrator, Editor, or Author role (provided the author is maintained in the Author governance attribute in the diagram) can copy objects from a diagram in read-only mode, such as the preview or published state. Select an object and copy it with the Ctrl+C key combination to copy it to the clipboard. Then, it can be pasted into another diagram in edit mode, provided that the object type in question is generally permitted there.
Note
Please also note that no individual formatting is transferred from the original diagram in this case. If, for example, colors or line types have been adjusted, this information will be lost when inserting.
How can I copy and paste objects from relationship attributes (attribute-based)?
As a user with the Administrator, Editor, or Author user role, you can copy objects referenced in relationship attributes and paste them into compatible relationship attributes afterwards. To do this, open the Diagrams menu item in the left menu bar and select a diagram from the Public workspace stage.
In the diagram view, you find the Details panel in the right sidebar. The attributes of the selected object are displayed there, provided that relationship attributes have been maintained beforehand. Depending on the administration settings in BIC Process Design, the displayed attributes may vary.
Hint
Please note that the method setting is relevant for using this feature.
To copy an object from a relationship attribute, right-click the object in the relationship attribute in the checked-in diagram. Select the Copy option.
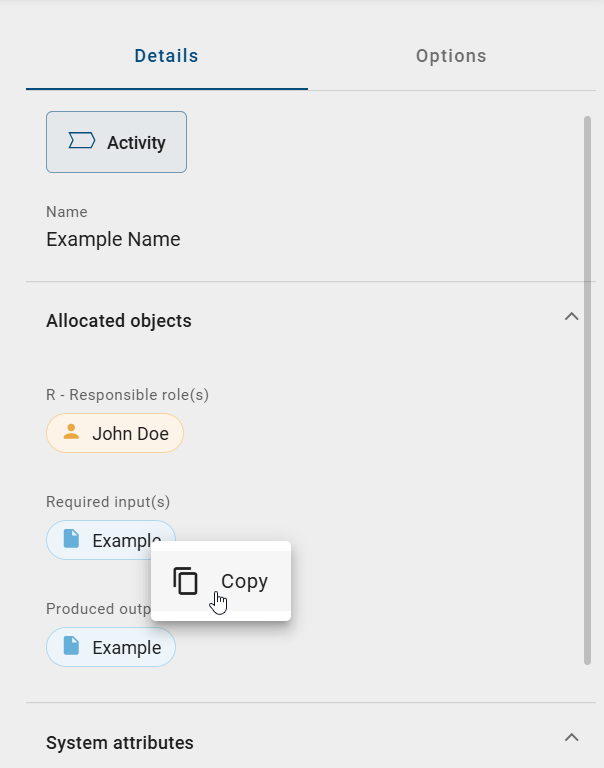
Alternatively, you can also select an object directly in the diagram that is referenced in a relationship attribute. The Details panel then opens in the right sidebar. There you see all attributes of the object. When you click an object, the details of this object are displayed. Then open the context menu in the upper right corner (three dots) and select the Copy option.
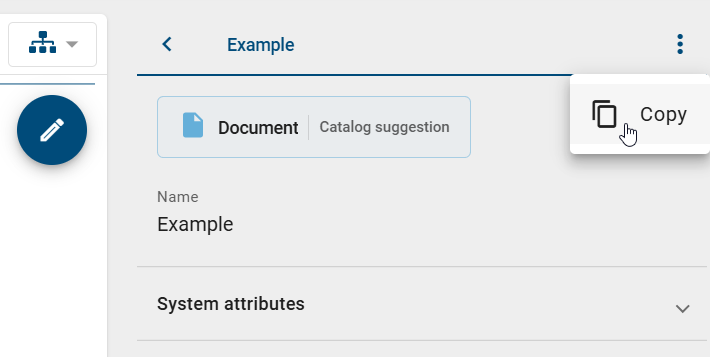
The object is copied to your clipboard. A confirmation message appears in the lower right corner of the screen.
Hint
The Copy option is only displayed if you have editing rights. Users with the Reviewer or Reader user role do not see the Copy option, as they do not have editing rights.
To paste a copied object into a relationship attribute, open a diagram, check it out and select another object. The object must have at least one relationship attribute. In the right sidebar, you can see the associated relationship attributes on the Details panel. Click in the input field of the desired relationship attribute.
The system now automatically checks whether the copied object may be used in this diagram and in the selected attribute group. If that is the case, the Paste button is activated. Click it to paste the object you copied earlier. The object is then linked in the relationship attribute.
If no object is available in the clipboard or the object is not valid, the Paste button remains deactivated.
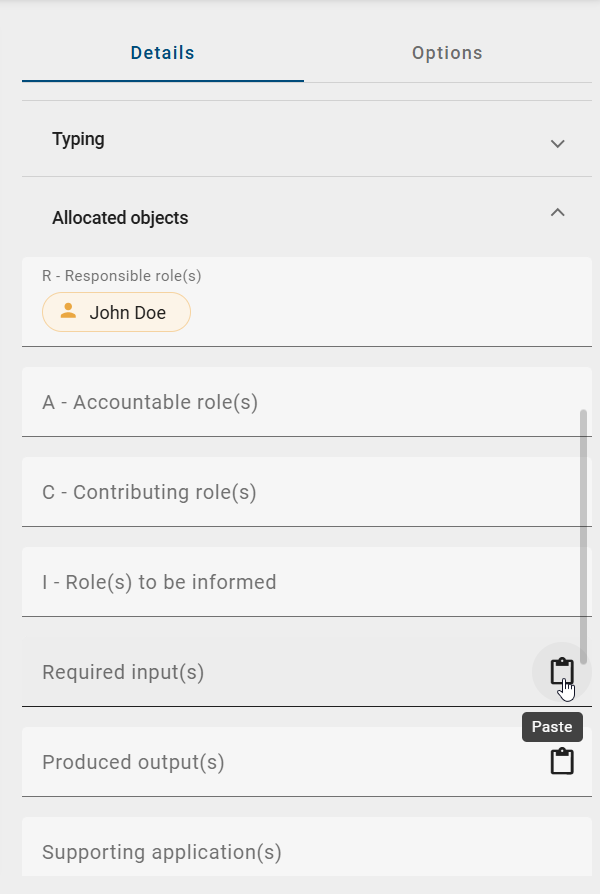
Tip
You can also use the keyboard shortcut Ctrl + V to paste.
After pasting, a confirmation message appears in the lower right corner of the screen. The object remains in your clipboard. You can paste it again if needed.
How can I cut symbols from a diagram?
Click on a symbol that you want to cut. Now use the Cut button in the editor to select the desired symbol (alternatively CTRL+X).
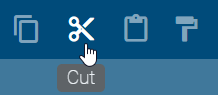
Optionally you can right-click on an object to open the context menu and select Cut.
How can I delete symbols from a diagram?
Right-click on the symbol you want to delete to open the context menu and select Delete.
Optionally, you can delete selected symbols via the Del button on your keyboard.
If the object is connected with other objects via exactly one incoming and one outgoing edge of type Sequence Flow, a new edge of the same type is created. This connects the neighboring objects with each other in the same direction. The attributes of the previously incoming edge are adopted for the new connection.
Deleting symbols in the diagram does not automatically delete associated catalog items in the catalog. This creates unused catalog items, which can be reorganized.
Note
You can also use the multi-selection of symbols to delete several symbols at the same time. The new edge is also created here for the neighboring symbols, but without the transfer of attributes.
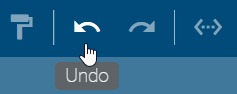
How can I undo or redo modeling steps?
To undo individual modeling steps, select the Undo button in the editor or alternatively CTRL+Z.
Use the Redo button to restore steps. Alternatively, press CTRL+Y.
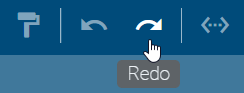
The Redo button and Undo button can be used until the diagram has been changed.
How do I add images to a diagram?
When you open the Diagrams menu item in the left menu bar, all diagrams available in the current repository are displayed in the main area. If you open the Diagrams menu item as an Administrator, Editor, or Author, you can create a new diagram or open an existing diagram for editing. In edit mode, you can insert images directly into a diagram. The file formats jpg, jpeg, bmp, png, and gif (without animation) are supported.
To insert an image into a diagram, first open the desired diagram and check it out to activate edit mode. You can then insert image files directly into the diagram editor. To do this, you can either drag and drop from the file system or paste from the clipboard. To do this, copy an image from any source and paste it directly into the diagram editor using Ctrl+V. Both methods are supported.
Tip
The functions Edit shape, Format and Change size can be used for editing an image. For example, you can crop your picture or set a frame.
Note
Copying images between different browser tabs is not supported.
Note
Files stored in interlace mode, such as available for PNG files, are not fully supported. This includes the print preview. In this case, saving the affected file without interlacing and inserting it into the modeling is recommended.
How can I add an image to an activity?
You can add an image to an activity (or any other object). This can be helpful, if you want to create navigation objects and want to highlight them.
To do that, you need to do the following:
Check out the diagram in which you want to add the image. Copy the image which you want to add. Select the activity (or other object) that the image should have as background. Paste the image (Ctrl+V).
Formatting
The different formatting options affect not only free-stream symbols but also symbols, such as activities and connections.
How do I change the format of symbol and diagram?
First, select at least one element on the canvas. Then, navigate to the format settings via the options.
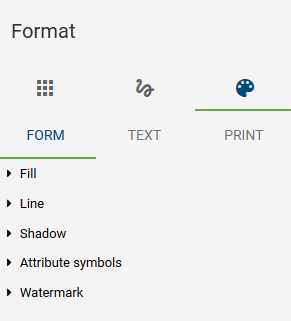
You can now choose between Form and Text.
What options do I have to format objects?
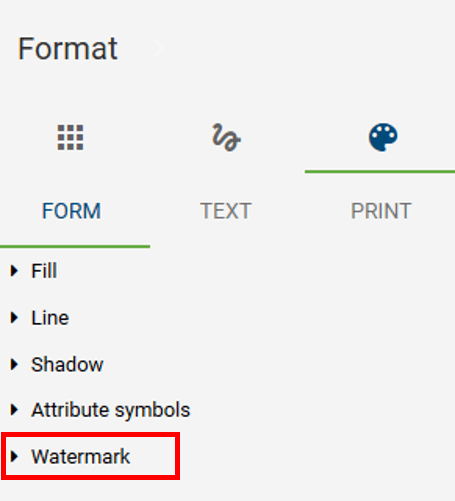
Available settings for the form of symbols:
Fill: You can choose between the following options for the filling of a symbol: None, Solid or Gradient. You can also adjust the color and transparency of the filling.
Line: For the line of a symbol, you can select whether there is no line or a solid line. Furthermore, the transparency and the color can also be set. In addition, you can set the style of a line (for example: dotted line, etc.) and the line width. With open symbols, such as connection or the free form symbol line, you can change the edge shape as well as the arrow type. To adapt these characteristics the following options are available: Line End, Line Join, Start Arrow Type and End Arrow Type.
Shadow: You can choose different shadow types for a symbol. The color can also be set here.
Attribute symbols: You can enable or disable the display of attribute symbols for an object. Attribute symbols are the icons that appear below an object, for example when a description has been maintained.
Watermark: You can enable or disable the display of watermarks and create them for symbols. In this case, there is a wide range of adjustment options, such as the adaptation of the size and color of the watermark.
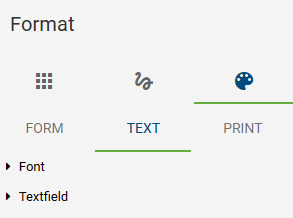
What are the options to format text?
Available settings for the text in symbols:
Font: The font, size, color and style of texts can be changed.
Text field: Defines the behavior of the text field, e.g.: do not resize form. Furthermore, you can define the position of the text field. Your options are: at the left, right, upper and lower text margins.
How can I transfer a formatting?
The copying of a specific formatting is available to modelers as a functionality in the editor. This allows you to transfer formatting from one object to the next.
Select your formatted object by clicking on it once. Then select Copy format in the editor. Once you click on the button, you can transfer the format to another object. If you double-click, you can edit several objects.
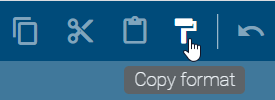
Click on the object to which you want to transfer the formatting. With a click somewhere in the empty editor or pressing ESC you can cancel/exit the Copy format mode.
How do I change the shape of symbols?
You can change the shape of existing symbols.
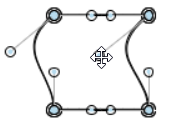
Select a symbol in the editor that you want to modify and select Edit shape by right-clicking in the context menu. It is now possible to edit individual points of the symbol, which allows you to change the shape of the predefined icons.
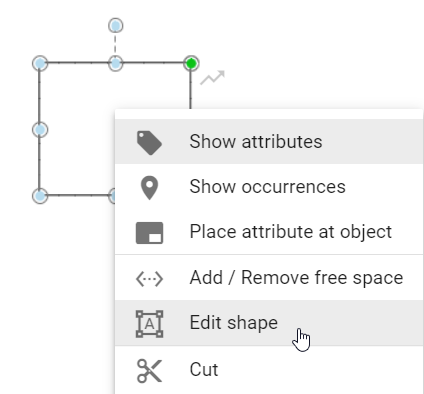
Change the symbol by moving an editing point to a different position while holding down the mouse key. You can repeat this for further processing points. The editing mode is active until you click somewhere in the editor. The same processing also applies to connections.
Support for visual adjustments
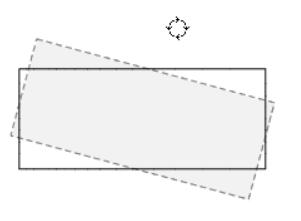
How do I rotate symbols?
You can change the orientation of symbols in the editor. That means it is possible to rotate symbols to any position you like. Analogous to the position and size, it is also possible to change the orientation of symbol names independently of the orientation of their symbols.
Click on a symbol in the editor. If you only want to change the orientation of the name, click on the symbol twice. A circle appears above the symbol. Select the circle above the symbol by mouse click and drag it to the left or right to change the orientation of the symbol. This allows you to rotate the symbol for example by 90 degrees.
How do I change the order of symbols?
You can define the order of overlapping objects in the editor. This applies to all objects you can use in the editor, including free forms and connections.
Select the object. Then navigate to the Order button in the editor.
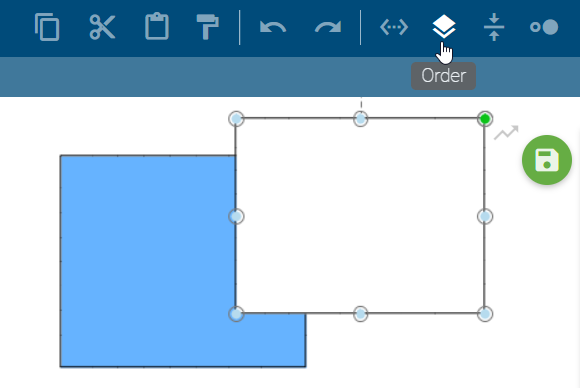
Four options are available:
To foreground: The selected object becomes the top level of the overlapping objects.
To background: The selected object becomes the lowest level of the overlapping objects.
Move up: The selected object is set one level higher.
Move down: The selected object is placed one level lower.
Once one of the options is selected, the arrangement of the symbol changes accordingly.
Note
Recently created objects always lie within the topmost plane of arrangement. This layer can still be changed later. Pools always lie within the lowermost plane of arrangement due to their technical meaning.
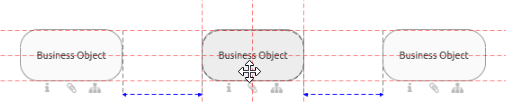
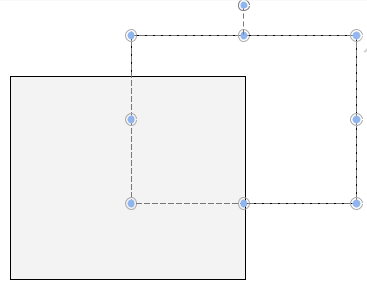
How do I use the alignment tool?
To simplify the positioning of symbols, you can use the alignment tool, both for existing symbols as well as for the creation of new symbols in the editor.
Open an existing diagram that contains symbols and drag a symbol from the symbols view into the editor. Afterwards, align the symbol with other symbols by placing it beneath another one. You will see that alignment lines are displayed. They can appear at the outer edges of symbols as well as through the center of a symbol, depending on the position to other symbols.
Tip
You can turn off the alignment tool by pressing the Alt key while positioning the symbol.
Warning
In the Google Chrome browser you can turn off the alignment tool with Alt and Alt GR. When using Internet Explorer, keep in mind that the Alt key opens the menu bar of the browser. So please only press Alt GR for turning off.
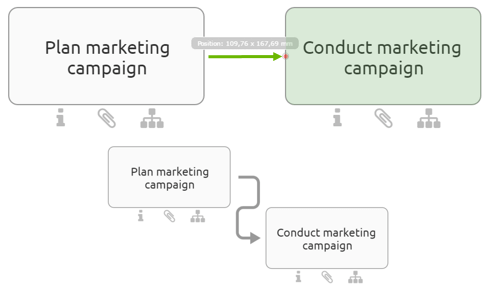
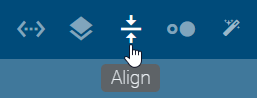
How do I align symbols to each other?
You can use an Alignment function to align symbols to each other.
To do so open a checked out diagram that contains elements that you want to align to each other. Select several elements at the same time, either by dragging the mouse with pressed key over the area in which these elements are located, or by using the Shift key and clicking on the symbols. To finish, select Align in the editor and select an entry (for example, Top align). The elements are aligned to each other according to the first selected entry.
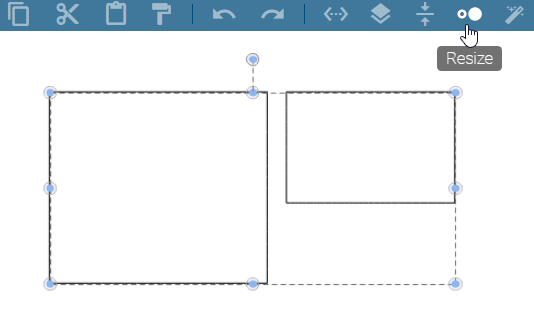
How do I match the size of symbols to each other?
Open a checked-out chart that contains items whose size you want to match. Then, select several elements at the same time, either by dragging with pressed mouse key over an area in which these elements are located or by using the Shift key and clicking on the corresponding symbols.
Select Resize in the editor and select an entry (for example, Fit to largest Shape). The size of the elements is adjusted accordingly.
How do I add or remove space?
With the function Add / Remove free space, you have the option to insert or remove space between symbols.
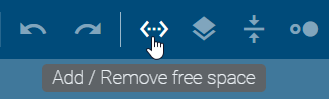
In your checked-out diagram, you can access the function by a click on the option Add / Remove free space in the editor. Alternatively, open the context menu by right-clicking in the editor and select the entry Add / Remove free space there.
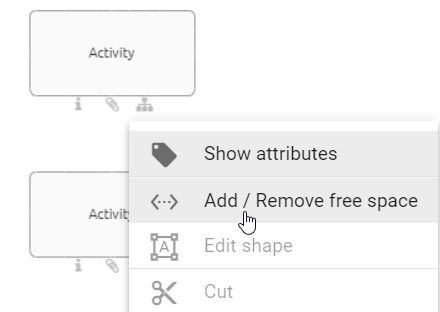
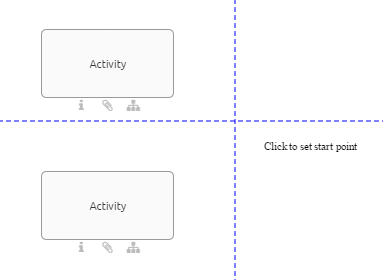
Two blue dashed lines appear, one running horizontally and the other vertically through the diagram.
Click on a point in the diagram to set the start point where you want to start removing or adding free space.
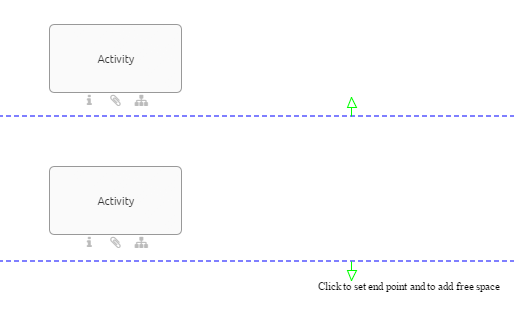
Add space
Click on a point in the diagram that is located on the right side or underneath the start point to add free space.
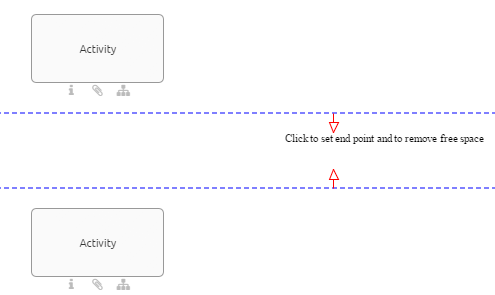
Remove space
Click on a point in the diagram that is located on the left side or above the start point to remove free space.
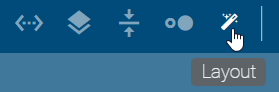
How do I use the layout assistant?
The layout assistant helps you to layout the process flow. This means that the sequence flow and activities are in the foreground. By default these are the diagram types BPMN, EPC and VCD. In edit mode of these diagrams you can layout the selection of a container object, multi-selections as well as the entire modeling. After layouting, the diagram is positioned at the 0/0 corner. In order to layout the whole modeling, you should not select anything in the diagram or select a symbol, which is not a container symbol. Your selection persists after layouting.
Click on Suggest layout in the editor. This will automatically layout the objects involved in the process. In the meantime, the editor is overlaid by the corresponding message. It is distinguished between satellites and sequence flow.
Satellites: The various satellites associated with an activity, such as roles and documents, are divided into quadrants according to their modeled position. Within this quadrant, the satellite is automatically positioned uniformly depending on the modeling. Furthermore, the edge ports are reassigned here. The arrangement of the edges in EPC diagrams takes place on the right and left side of activities. In BPMN diagrams, the ports are created at the top and bottom of activities.
Sequence flow: Mainly underlying activities are assigned to a column. In the same way, adjacent activities are assigned to rows. Within these rows and columns, the activities are arranged in a straight line using the layout assistant. An activity including satellites is considered as one related object. This affects the height and width of columns and rows. Sequence and message edges between activities are reassigned if necessary.
Note when layouting containers in the diagram:
If you want to layout the whole diagram with a container in it, the size of the containers is adjusted in addition to the changes described. The containers thus keep a configured distance from the internal elements. When resizing, however, the header side of pools is excluded, so that no configured distance is kept there.
If a container, such as a horizontal or vertical pool or lane, is selected, the layout assistant takes the symbols within this container into account. The layout of the elements in any container always follows the same rules, while the container size remains unchanged.
This chapter describes the default settings. The layout may behave differently, if the settings to a diagram types are adjusted in administration area of BIC Process Design.
Note
The layout assistant does not support the simultaneous use of horizontal and vertical pools within a diagram.
How can new symbols be layouted automatically?
The layout assistant is permanently activated by pressing CTRL -key and simultaneously clicking on Layout. The associated icon remains highlighted in the menu bar. When creating new symbols with one click via the mini symbol palette, the symbols are directly routed and placed in the corresponding position.
With CTRL and left mouse button, the permanent setting can be deselected again. A single click on Layout still corresponds to the Layout described above.
Note
The “Undo” and “Redo” modeling features exclude these layout assistant changes.
Details and Options
This section explains various display settings of diagrams and symbols used in diagrams. These options are each part of the details and options on the right side of the page and are directly linked to attributes of objects and diagrams. For each diagram, the details and options are open by default during modeling.
Depending on the administration settings in BIC Process Design the details and options can contain different attributes. In the publication, the details are displayed by default when you open a diagram.
Attributes
How do I display attributes in diagrams?
As a user, when you open the Diagrams menu item in the left menu bar, you can access all of the diagrams in the current repository, which can be sorted by category.
Once you have selected a diagram from the Public workspace stage, you can check it out as an Administrator, Editor, or Author. In the checked out diagram, you will find the diagram attributes in the Details panel in the right sidebar. The attributes may vary depending on the administration settings in BIC Process Design in the different areas.
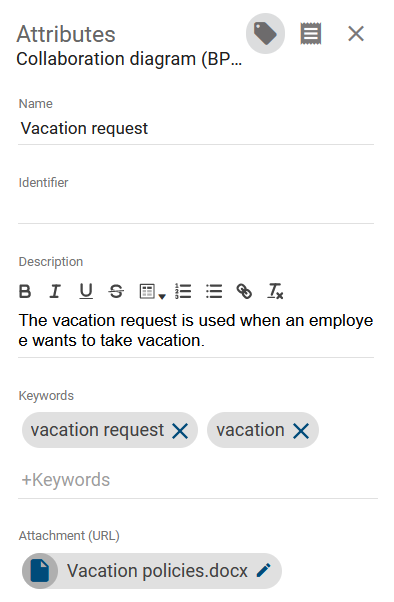
If you select an object in the diagram before or after opening the Details tab, the corresponding attributes are displayed in the right sidebar. For each modeled object, the object type in your browser language and the current catalog status (e.g., catalog suggestion) are displayed. The system attributes are displayed in your browser language and cannot be edited.
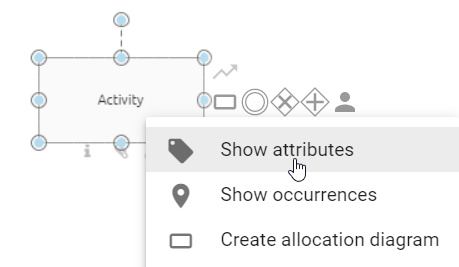
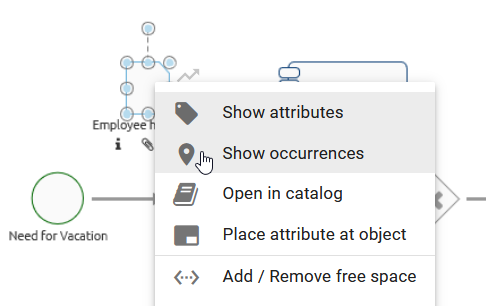
Optionally, you can right-click on a symbol and select the Show attributes option from the context menu that appears to display the attributes of the corresponding object. If you right-click on an empty area, you can display the attributes of the diagram.
In the Details, all attributes of the diagram or of the selected object are displayed. You can edit the attributes or set a new value if an attribute has not been maintained yet. When you maintain relationship attributes, they will be sorted alphabetically after you check in the diagram. Please note the behavior when you change a catalog object. By default, additional attribute groups, such as Governance, are collapsed in the Details. By clicking on the respective heading, you can display the related attributes.

Hint
Please be advised that when multiple elements are selected in a diagram, the details of a single element cannot be displayed.
How do I create a link to another diagram?
You can place links to other diagrams to create subprocesses of diagrams. These subprocesses allow you to map diagram hierarchies.
Create an activity in a diagram and open the attributes of this activity. Then, in the attributes, click the Subprocess attribute. Afterwards insert the name of the diagram you want to save. You will receive a suggestion list of diagrams containing the entered term in the name.
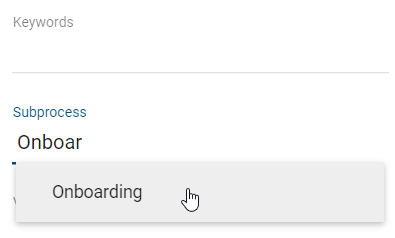
Select the diagram from the suggestion list. The subprocess is saved and is made visible in the diagram by the attribute symbol showing up below the activity.
Note
Variants and allocation models can be linked in the same way. Only existing diagrams can be linked as they are added via the suggestion list.
Tip
If you also maintain the process type of the activity as Call activity, a subcase in BIC Process Execution will be started for the subprocess.
Hint
Please note that diagrams accessed through a shared link can also be viewed by users who do not have read permission for that stage. In addition, limited navigation to other linked diagrams (e.g., subprocess, variants) is possible.
How can I connect users to diagrams and objects?
The attributes of diagrams and objects can be used to connect to users and user groups. This is possible using the governance attributes author, reviewer, responsible, scope, and restricted access for various functions.
Navigate to the appropriate attribute in the catalog or diagram. Then enter a term and you will get a suggestion list of all users or user groups that contain this term in their name. You can select a suggested user or user group by clicking on it. The corresponding person or organizational unit from the catalog will then be entered in the respecting attribute. Finally, save your changes.
Tip
You can also search for the user’s email address. If a user is selected from the list and is not linked to a catalog object of the type “person”, a new catalog item will be generated with the name and the email of the given user. If more than one person exists with the email address you are looking for, the catalog item found first will be taken by selection of the user.
How can I maintain governance attributes?
You can maintain governance attributes for diagrams and some catalog items. To do this, check out the affected diagram or navigate to the corresponding catalog item and open the attributes. In the Governance attribute group, you can use a suggestion list to select users and user groups. The corresponding catalog object person or organizational unit will be set for the attribute, when the user or user group has been selected from the suggestion list. When you save the catalog item or additionally check in the diagram, your changes are taken over. The different governance attributes and their functions are presented below.
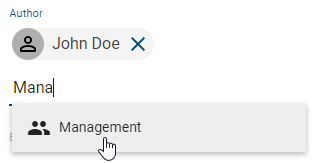
Author: Users of the role Author only have the permission to edit diagrams if they are entered as author in the diagram attributes. This is possible for both users and user groups. In addition, you can enter authors in governance attributes of catalog items. Then not only creating and editing suggested catalog items is allowed, but registered authors can also edit accepted master data. An author of a published diagram or catalog item is (by default) informed via email about a resubmission.
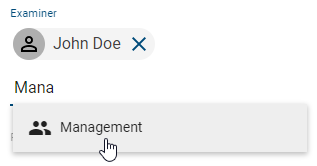
Examiner: Users who are registered in the attribute Examiner execute the release step of a publication and will be notified of the pending release step. The examiner role can be assigned to individual users as well as user groups per diagram and per catalog item. Per entry, that means per person and per organizational unit, one approval is required in the examine step to initiate the next workflow step. The first three examiners of a published diagram or catalog item are (by default) informed via email about a resubmission.
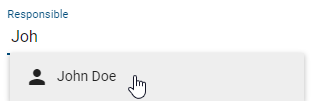
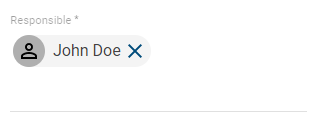
Responsible: A maximum of one user or user group can be entered in the Responsible attribute. This entry is required if a catalog item is to be published individually or the diagram is to be published. The responsible user or user group is finally notified at the release step of the publication and can confirm it. Moreover, they receive a notification and a resubmission task before the validity period of a diagram or catalog object is reached. The attribute responsible (resubmission) can be used instead. In this case, the responsible will receive the information mail about the scheduled resubmission.
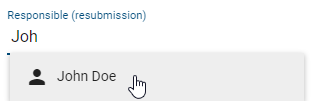
Responsible (resubmission): The Responsible (resubmission) attribute is available for diagrams and catalog items. Either an individual user or a user group can be entered here. The responsible persons then receive the notification and a resubmission task before the validity period of a diagram or catalog item is reached. If this attribute is empty, the Responsible receives the corresponding task and notification.
Tip
You can also search for the user’s email address. If a user or user group is selected from the list and is not linked to a catalog object of the type “Person” or “Organizational unit”, a new catalog item will be generated. This will have the name and email of the corresponding user or the name of the user group as name and identifier.
Special retention period (in years): This attribute enables you to define an individual retention period for the archive entries of the concerning diagram or catalog item. The retention period determines for how long an entry is saved in the archive. A general setting can be made in the administration. In case the period of archive entries in publication stage should differ for your diagram or catalog item, you can set the desired value here. Maintaining an integer greater than zero leads to an archiving of new entries for the corresponding number of years whereas negative values will be ignored (i.e. the time set in the administration is applied). If no archive entries should be created for this object (in publication stage), simply enter the number zero.
Hint
Please note that the attribute Special retention period is deactivated by default. If it should appear in the governance attributes, it can be activated in the method. However, the special retention period is only applied to a diagram or catalog item if the general archiving has been activated for the corresponding type in the administration.
Which functions are available for the attribute description?
Each symbol and diagram has a description attribute. When you edit the description attribute for an object, some object types show a description icon by default.
Click on the description attribute of a symbol (e.g. an activity). Various formatting options are available for the description attribute. These are:
Bold
Italic
Underline
Strikethrough
Table
Numbered list
Bulleted list
Add links
Remove format
(Add AI-generated description)
Set the formatting according to your requirements and finish the editing by clicking in the diagram.
Add a link:
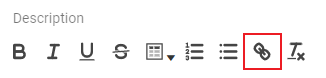
You have the possibility to link documents or URLs within the description field. To create a link, click on the link symbol.
A dialog opens where you can enter the link and optionally a title, i.e. a text which is displayed.
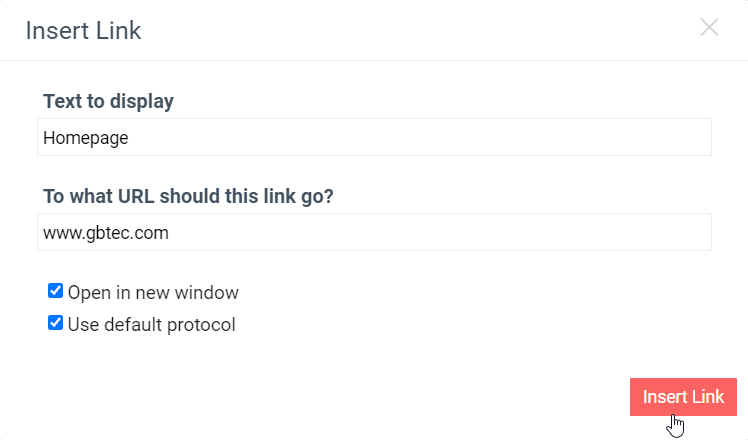
You can also mark a piece of text in the description field and click on the link symbol to fill the title automatically and attach the link to the existing text. In the dialog, you have two further options. First, you can choose whether the link is opened in a new tab (activate checkbox) or in the current tab when it is selected. If you select the second option, the default protocol http:// is used for your URL. Deselect the checkbox in case you use another protocol, like mailto://. Both options are initially activated. When the configuration is implemented according to your wishes, select the button Insert Link. Your configuration will be saved and the dialog closes. To discard the data instead, close the dialog via the cross button in the upper right corner.
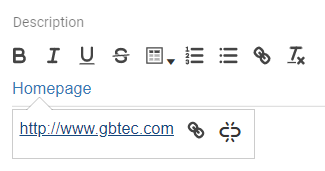
The title of the link is displayed in blue color afterwards. If you select it once, a pop-up will show the link and two buttons. Selecting the right one removes the link (the displayed text remains). The left button can be used to re-open the configuration dialog for further editing.
Table:
In order to insert a table, click the table icon to open a selection field. You can define the size of the table by hovering over the grid and confirming the desired columns x rows numbers by a click. The table is pasted into the description field. If you mark the table, you can move it to a desired place using drag & drop. To adapt the formatting of text inside the table, simply use the functions mentioned above. If you place the cursor in a cell, further functions are displayed to insert new rows and columns. You can also delete the current row/column. The bin icon enables you to remove the whole table. The table is removed instantly after selecting this function and there is no further confirmation necessary. Therefore, be sure about the deletion before selecting the function!
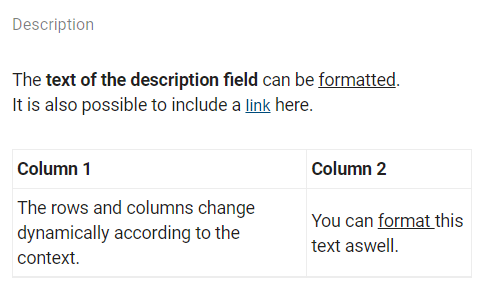
Note
Please note that if you use a description attribute that contains an HTML table and place it on the modeling canvas, the table borders will not be visible. In addition, when copying a table from PowerPoint, it may appear twice, once without formatting and once with formatting.
The maintained description attribute is indicated by an i under the symbol. Descriptions of your process steps and other symbols are displayed in a tooltip as soon as you move your mouse over the highlighted information icon of the object.
If you view descriptions of checked-in diagrams that contain more than 3 lines, they are displayed collapsed by default. You can see the entire description by clicking on Show more and minimize it by choosing Show less.
Note
For some object types the icon for maintained description attributes is not visible by default. It is possible to change this in the formatting options for a selected symbol.
Hint
The table formatting is not fully supported in exports. If you use a table in a description attribute, the content is still copied to the document as a table and appears in the defined formatting. But the table is displayed without a frame and border lines of the rows and columns.
How can I generate a description from AI?
Starting from version 7.13, the feature to generate an AI-generated description is available. For this, you need to be in the local workspace and check out the respective diagram.
To use this feature, the diagram or entity in question must have a name and not contain a description. Subsequently, the button for generating an AI-generated description will be activated.
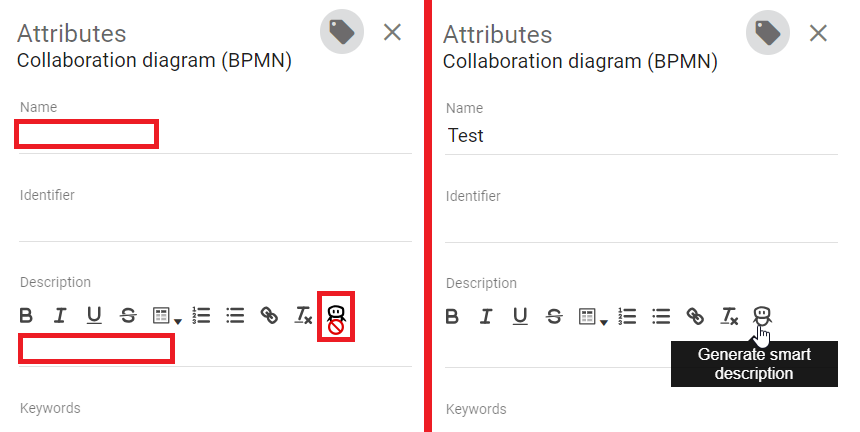
After clicking the button, you will receive a complete description of the diagram or entity within seconds, which you can adjust as needed at any time. Subsequently, the button deactivates and can be used again if the description is empty.
Hint
This function is performed by Arty, our AI Modeler. Please note, that this function requires a separate license. Please also refer to the notes on using the AI feature.
What is a mandatory attribute and how can I detect it?
In the attribute tab, an asterisk marks a mandatory attribute. This applies both to the attribute tab in the diagram view and to the object details in the catalog. Entering such an attribute is mandatory to publish the diagram resp. catalog object. If these are not maintained, you will get a corresponding message in the application when initiating the release workflow. If you create or edit an entity, you do not have to maintain the mandatory attributes yet. Attributes can be defined as mandatory in the method.
For example, the attribute Responsible always is a mandatory attribute.
Note
The following exceptions will be applied to mandatory attributes that are multi-valued or language localized when the release workflow is initiated. The workflow engine checks if at least one value has been maintained for all mandatory multi-value attributes. There is no further check about the amount of values. The check for language localized attributes is successful if a value has been maintained for at least the default language of the tenant. If this attribute value has not been set, the initiator of the release workflow receives a notification about the missing translation in the diagram resp. catalog object.
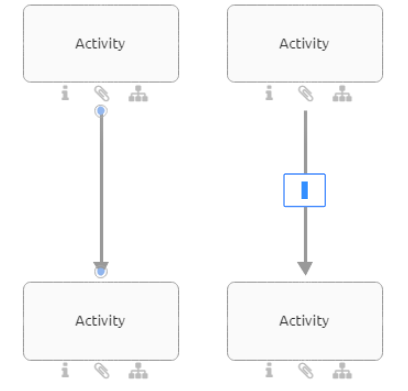
What are occurrence attributes?
If you have multiple copies of an object, typically, the value of an attribute (for example, the name of the object) is the same for each of these copies. In contrast, the values of occurrence attributes can be set independently for each copy. If an object is copied, initially each attribute value is identical to the original value. These can, however, be subsequently modified without the other copies / the original being altered.
BIC Process Design uses a small symbol to indicate whether it is an occurrence attribute (see figure below).
Occurrence attributes are defined in the method and cannot be defined in the application itself.
If the occurrence attribute has to be of identical type in all variants of the object, then it must be maintained individually for each object.
The contents and the identifiers of the occurrence attributes are not included in the catalog.
How can I set the access restriction for objects?
You can use the attribute Restricted access to restrict access to an object for certain users. To do this, you must edit the attributes of the object either in the diagram or in the catalog. This restriction applies if the object exists in the catalog. Only members of the selected user group, registered users and governance participants can see the object in the catalog or reuse it via the suggestion list. The access restrictions apply regardless of the user role, so even administrators can be excluded. If the access restriction attribute is empty, there are no restrictions.
Warning
Reuses of the catalog items with access restriction are still visible in diagrams despite access restrictions. This applies to the entire object, including all its attributes, such as attachments and files. Additionally, this data is included in the archived versions of the diagram.
What are system attributes?
System attributes give the user information about the creator, the person who last edited the diagram and the associated timestamps of the diagram. These attributes are generated by the system and users can only read them.
You can view the systems attributes when a diagram is checked in. Open the corresponding diagram and navigate in the Details to the attribute group System attributes. Click on the attribute group to see the associated information.
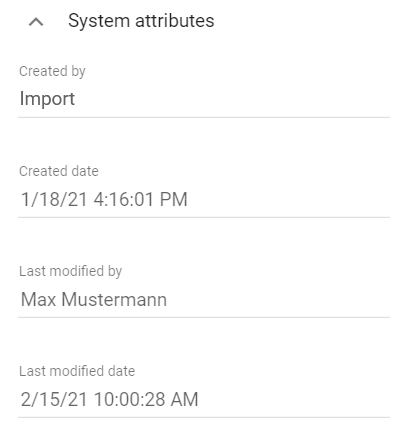
Note
As a user with at least Reviewer rights, you will find the number of diagram visits in the system attributes when viewing the diagram in publication.
Note
When the diagram is published by the workflow engine, the system attribute “Last Modified By” of the diagram is set to “Workflow” in all stages.
How can I switch directly between linked objects and edit them?
Users with at least the Author user role who are entered in the Author attribute of a diagram and work in the Public Workspace can navigate directly between linked objects within a checked-out diagram using attribute references and edit them. To do this, open BIC Process Design and select the Diagrams menu item in the left menu bar. There you can either create a new diagram or check out an existing diagram.
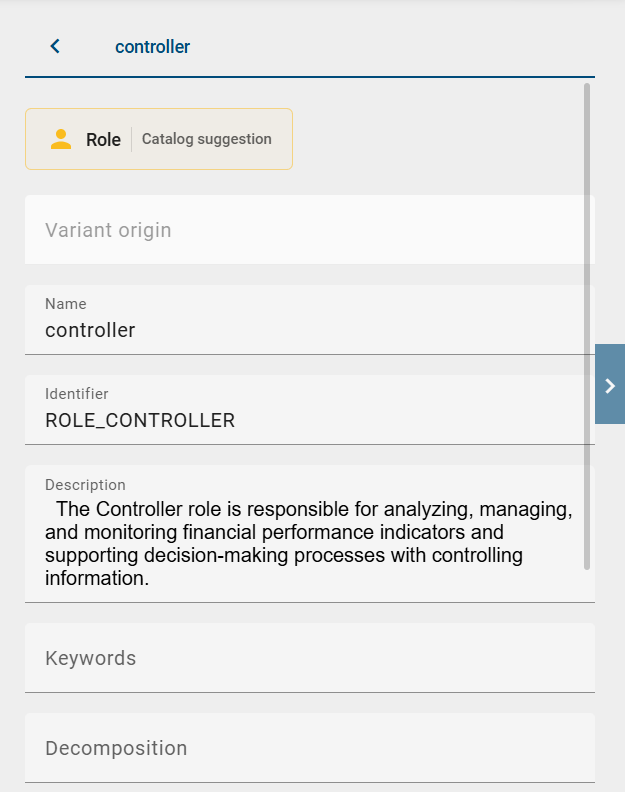
After opening the diagram, click on the desired object in the diagram. The assigned catalog objects are displayed in the Allocated Objects attribute group in the Details tab in the panel. These assignments are created, for example, by relationships between the selected object and the assigned catalog objects that you create via connections in the diagram, or by selecting a catalog object in a relationship attribute. Clicking on the chip of a catalog object opens its detail view directly in the panel.
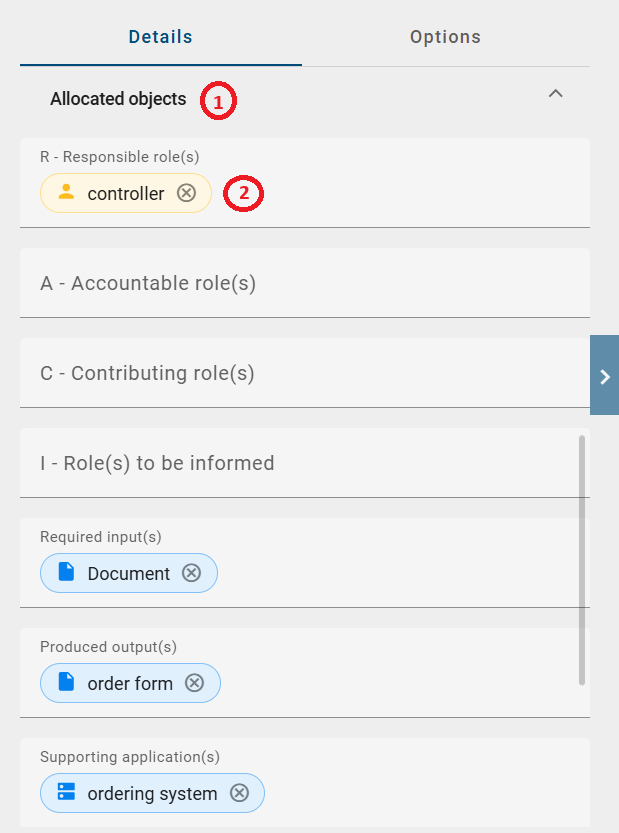
You can edit the selected object in the panel. All attributes displayed in the detail view are editable. Changes are immediately displayed in the user interface, but are only permanently applied once you save and then check in the diagram.
Hint
Please note that in edit mode, only objects that are directly related to each other (relationship attributes) are currently editable. Objects that are not directly related to each other (reference attributes) are currently not editable.
Note
Please note that when you edit attributes in the diagram, you are directly changing the underlying catalog object. If this is a catalog object that has already been approved, a catalog suggestion is automatically created.
Use the arrow in the upper left corner of the panel to return to the previous object detail view.
Attachments and Integrations
How do I attach files to objects?
Modelers have the option to upload their own files (up to max. 64 MB) and link them to an object in a diagram. The file can optionally depend on the users’ language settings.
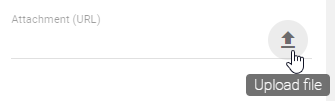
Navigate to the attributes of the object to which you want to attach a file. In the Attachment (URL) attribute, you can select a file from your folders by clicking on Upload file. BIC Process Design supports the following file formats:
.ods, .xls, .xlsb, .xlsx, .xltm
.pdf
.potm, .potx, .pps, .ppsm, .ppsx, .ppt, .pptx
.doc, .docm, .docx, .dot, .potm, .dotx, .odt
After you selected, a dialog opens where you can rename your file. Via the checkbox Upload for all languages you have to decide if the attachment is intended for all languages (select checkbox) or only for your current content language (unselect checkbox).
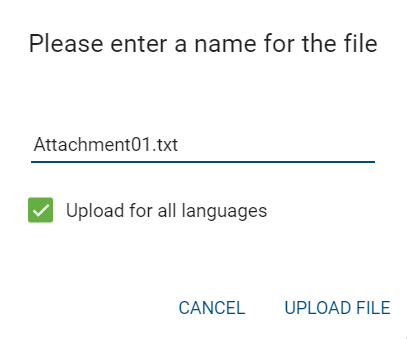
Click on Upload file to confirm your input and to attach the file to the object as a chip with the name of your input.
In case you uploaded an attachment only for your current language, you can change your content language and add an attachment for other languages as explained before. A clear administration of language dependent attachments is also recommended in translation mode.
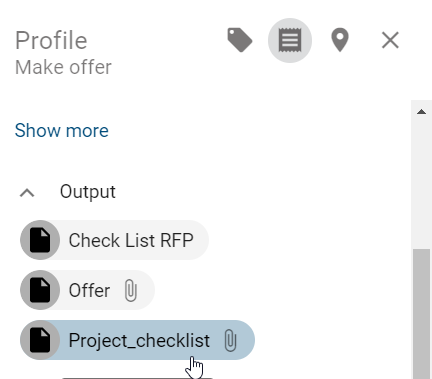
The uploaded file can be downloaded by other users by clicking on the attribute entry whereas the linked file is depending on the users’ content language. Another option for downloading these files is by providing a link for other users. Further options for downloading these files are also provided in the Profile and in the Matrix view, for example for inputs and outputs. Note that documents are stamped in the process of publication.
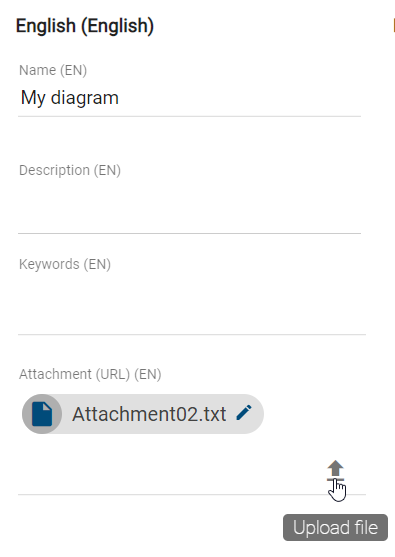
Optionally you can also insert your file into the attribute field Attachment (URL) of an object by using the drag & drop function and name it.
If you want to remove the attachment, click in the input field of the attribute, use the arrow keys to navigate to the chip (until it is highlighted) and press the backspace key on your keyboard to delete it.
Hint
Please note that permanent links to attached files will only work persistently if the title of the attachment remains unchanged. Once the title is changed, the link becomes invalid, and the attachment can no longer be accessed or downloaded using the generated link.
Tip
URLs like links to documents on network drives can also be added as attachments.
Note
“/” characters cannot be included in the file name and are automatically removed when uploading. Moreover, the same URL cannot be added twice.
Hint
Please note that entering URLs and uploading attachments may vary depending on the attribute configuration in the method editor. The Upload file button or drag & drop attachments are only available if the attribute configuration allows attachments to be uploaded. The same applies for entering URLs.
Hint
Please note that the Attachment (URL) attribute can be restricted by an individual method configuration. In this case, it is only possible to store links or URLs, while other file types cannot be maintained.
How can I maintain language dependent attachments?
If you upload a file, you have the choice to link this file for your current content language or for all content languages which are selected in the administration. The translation mode offers a clear overview of the attribute Attachment compared in all content languages.
You can enter the translation mode when a diagram is checked in by clicking the option Translation mode in the options of the respective diagram.
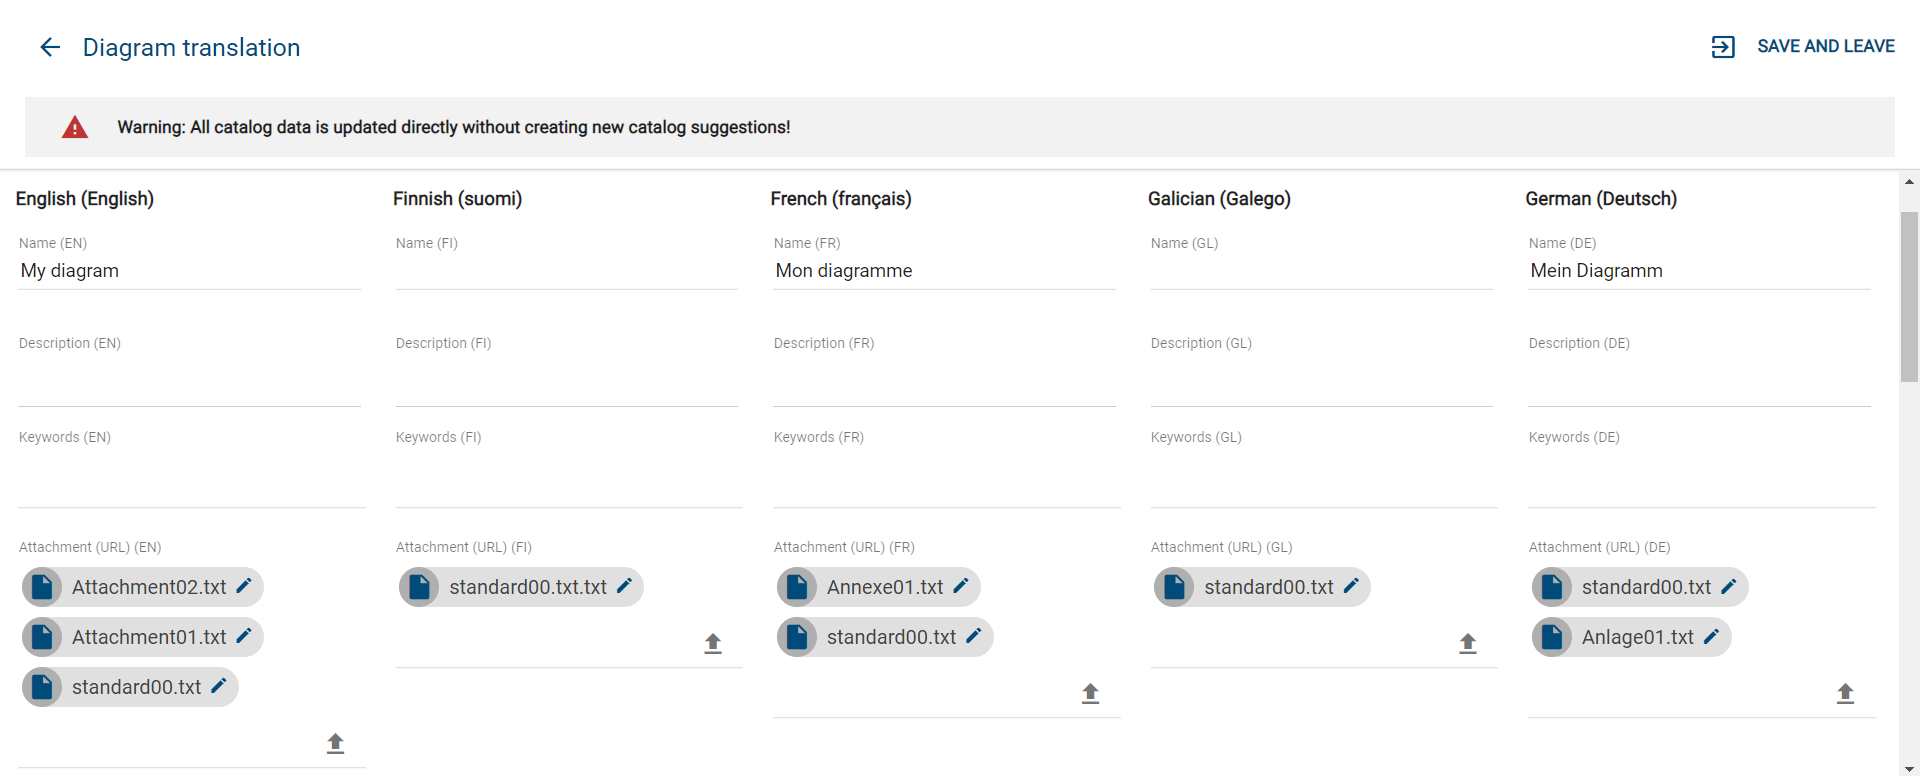
By a click on Upload file in the column of an arbitrary language, you can select and open a file as usual.
Via the checkbox Upload for all languages you can decide whether you want to link the file for all or only the selected language.
The function Edit enables you to change or rename the attachment also in translation mode.
Note
If you import a diagram containing an attachment that is not linked to languages, the attachment is maintained in every content language. Therefore no data will be lost. In case you would like to link the attachment to only one content language, you can adapt this attribute afterwards, for example using the translation mode.
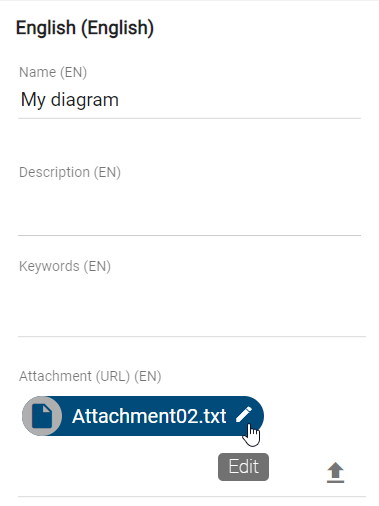
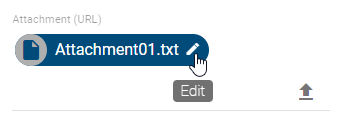
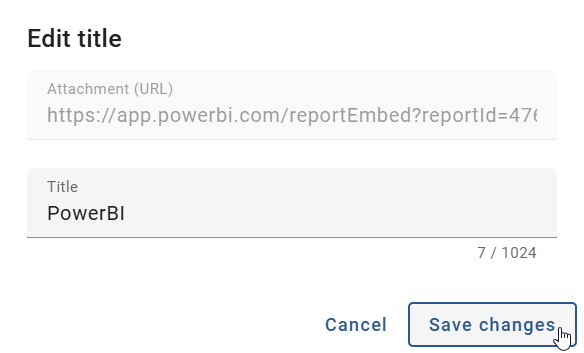
How can I rename attachments (URLs)?
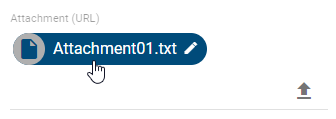
If the attribute “Attachment (URL)” is maintained, you can rename the corresponding attached file or URL language-independently. Navigate to the attachment, represented by a chip, in the attributes of the desired object. At the right edge of the chip you can select the option Edit, represented by a pen symbol.
This will open the dialog Edit title. In the field Attachment (URL) the URL, or the BIC Process Design-internal file path, is displayed but cannot be edited. In the Title input field, you can rename the attachment. Click on Save changes to take over the new title and display it in the chip.
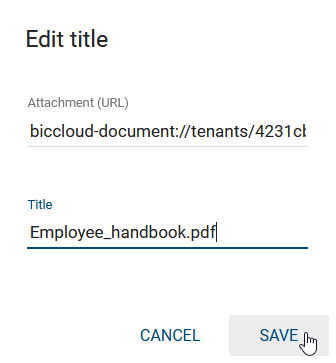
If you do not want to save your changes, click Cancel.
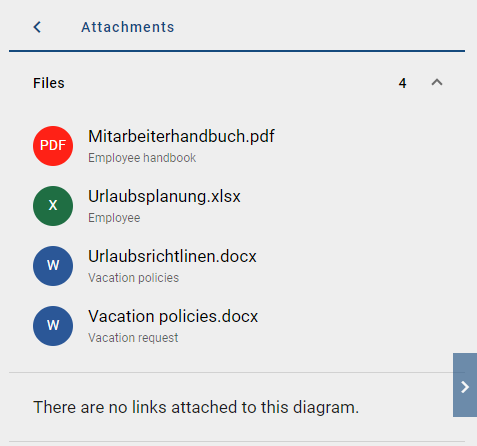
How can I access attachments of entries?
If you have maintained a file or URL in the attribute “Attachment (URL)” for an object, they can be accessed directly.
The sorted order of maintained files and/or URLs is alphabetical. If an object is not maintained in your active content language, it will be moved back in the list and labeled as [no Content]. If a diagram lists an object with restricted access or if an object differs from a specific stage, it will appear at the end of the list.
Navigate to the Details of a diagram or object. If the chip of an entry contains a paperclip, an attachment is maintained. Clicking on the paperclip opens the attachment directly or instead a selection menu if several attachments are available.
Hint
Please note that the Attachment (URL) attribute can be restricted by an individual method configuration. In this case, it is only possible to store links or URLs, while other file types cannot be maintained.
How can I access all attachments of a diagram?
If you want to access all previously maintained files or URLs in the diagram while modeling, navigate to the options and click on the Attachments entry.
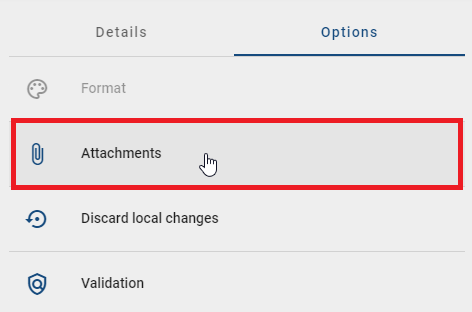
Whether you have selected an object or not, all maintained files and URLs in the diagram are now displayed and can be opended or downloaded.
How can I integrate external content in a new tab in a diagram?
Users with at least the Author role (provided they are maintained in the diagram’s Author attribute) can integrate external content into a diagram. This content will be displayed in a separate tab. To do so, click on the Diagrams menu item in the left menu bar and, if necessary, switch to the Public workspace stage. Then, select an existing diagram and check it out using the Check out button. If no diagram is available, you must first create one.
You will then see the Integration (URL) attribute in the Details panel in the right sidebar. Here, you can enter embeddable URLs whose content will be displayed in a new, separate tab. Only content from external websites that permit embedding and to which you have access can be displayed. If the URL is invalid, an error message will appear.

Once you have entered the embeddable URL, press Enter to confirm it. The integration will then appear as a chip containing the URL in all content languages. You can edit the integration title by clicking the Edit button. The title will be adjusted according to the currently active content language. To remove the integration, click the chip and press the Backspace key.
When you save and check in the diagram, a new tab will appear next to the Process execution view tab. This tab corresponds to the integration you provided and is visible to all users who have access to the diagram view. It will also be displayed when the diagram is published.

Hint
Please note that the use of integrations requires a separate licence, which you must purchase.
Note
You can add only one integration per diagram.
Occurrences
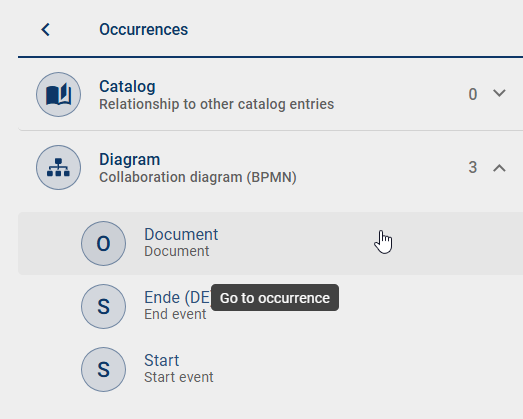
How can I view the occurrences of objects in checked-out diagrams?
To view the occurrences of an object while modeling, do the following:
Click on the desired object and navigate to Options in the right sidebar. Select the Occurrences entry. A list of all occurrences of the object is displayed.
The list is divided into two main sections: Catalog and Diagrams. The Catalog section displays the relationship of the selected object to other catalog items. The Diagrams section lists all the diagrams in which the selected object is used.
By clicking on a list entry, you can then navigate to another diagram where the object is used again, or display the occurrences in the current diagram.
Tip
You can also check the occurrences of an object while the diagram is checked in.
BPMN Collaboration
This chapter explains the modeling of a BPMN collaboration diagram.
How do I work with pools and lanes?
In contrast to other objects, lanes are not dragged from the symbol palette into the editor, but can be generated via a pool. This prevents lanes from being loosely modeled (i.e., outside of pools), which is not allowed according to the BPMN standard of OMG.
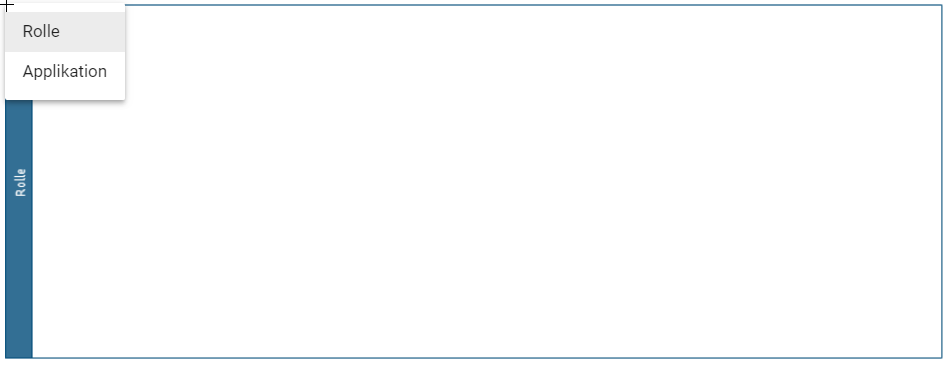
Create a pool:
Open your BPMN diagram and check it out. Afterwards, use drag & drop or stamp mode to model a pool from the symbol palette.

A selection menu for the pool opens. In this case, you may decide whether the pool will represent a Role or an Application. Please note that this decision cannot be changed afterwards.
Create a lane:
Select the pool located in the editor (a further subdivision of lanes can be made accordingly). There are some icons at the top right-hand side of the object.
If you click on the two horizontal strokes, two lanes are generated in the object.

Select a lane with a left-click. If you click on the arrow pointing upwards or downwards on a horizontal line, you can insert additional lanes above or below.

To change the position of the selected lane, click on the up or down arrow. The lane is moved up or down.

Note
A pool which is containing lanes can be selected by clicking on the blue header.
How can I change the color of pools?
Users with the Author user role or higher can adjust the color of pools, provided the author is listed in the diagram’s Author attribute. To do this, open a diagram from the Diagrams menu item in the left menu bar. Then, either add a new pool to the canvas or select an existing one. In the Options panel in the right sidebar, click the Format option.
Click on the Fill attribute within the Form attribute group. Here you can adjust the pool’s color. Save the diagram to apply your changes.
By default, pools are displayed in the color set by the administrator. This color is configured either in the Method tile or directly in the method. If the color is defined both in the method and in the administration, the color defined in the method takes precedence. If the color is reconfigured, it only applies to pools created after the change.
If you adjust the pool’s color using the Format option during modeling, the new color will be applied to the diagram.
How do I change watermarks of pools and lanes?
Watermarks are visible by default in the background of pools and lanes. These watermarks are repeatedly shown from a certain width of the symbol and automatically display the name of the pool or lane in the selected content language. You can adjust the watermark yourself as follows.
Navigate to the format settings via the Options.
Select the pool or lane including the watermark you want to edit. Click the menu button Form and open the entry Watermark. There you can remove the watermark by deselecting the checkbox Visible or you can rename the watermark and adjust it to your needs. Customization options include font size and color, as well as the location of the watermark within the pool or lane.
Note
If you rename the watermark itself in the symbol palette in the Text field, it will no longer initially display the name of the object. To have the name of the object automatically adopted again, you only have to remove your input in the symbol palette under Text or leave the input field empty.
How can I model inside and between pools?
As soon as you want to connect two pools, the connection type Message Flow is selected automatically. This applies also for connections between activities and connections between activities and events, which lie in different pools.

If those objects are connected within a pool the connection type Sequence is automatically selected.
In addition, connections can be modeled using the mini symbol palette. When creating a new object from the mini symbol palette of an existing object that is in the pool, the following is considered: If the new object is placed outside the pool and not in another pool, the pool is automatically enlarged. Thus, the pool contains the new object, which is connected to the other object via the type Sequence. If the new object is stored within another pool, no connection is initially created. This can subsequently be modeled again as a Message Flow via the connection symbol.
Please note that the connection type does not change by moving an object from another pool into the pool of the connected entity. This may cause validation errors.
What kind of task types exist in a BPMN diagram?
You have the possibility to change the activity type of an activity in your BPMN diagram. This provides two advantages. Firstly, the selected activity type will be displayed with an icon, which makes your diagram more readable. Secondly, BIC Process Execution allows you to provide templates for the specific types that can reduce the workload of your users.
If you want to change the task type of an activity you need to select the corresponding activity first. After that go to its attributes.
In the group Typing you can change the attribute Task type. To do that change the type as desired using a selection menu. It opens by a click on the marked arrow. The changes are also noticeable at the object itself through different icons that show up.
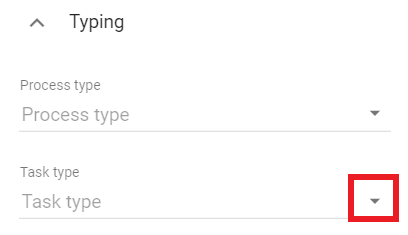
You can choose from the following options. But be aware that some template editors only work in combination with BIC Process Execution. Therefore your process must be marked as executable as well.
None: This is the default type for an activity. It does not allow the creation of any additional templates.
Send: This task type defines that an user has to send a message. BIC Process Execution allows the creation of an email template and the automatic sending of emails. It is symbolized by a filled envelope.
Receive: This task type expects that your user will receive a message. It is symbolized by an envelope.
User: A user task is a task which will be executed by one of your users (if necessary with software support). BIC Process Execution allows the possibility to define own user forms, where a user can input or calculate values and get output values.
Manual: The task type manual is characterized by the fact that it must be performed manually by a user. Therefore, it has no form of integration with BIC Process Execution. It is symbolized by a hand.
Business Rule: A business rule allows you to define certain rules and conditions to calculate an output value or to set a variable to a certain value. This chapter gives you more details about how to use the DMN editor. This type is symbolized by a table.
Service: You can use a service task to use REST Calls in your process. This means you can integrate other software components or web services with BIC Process Execution. The symbol of this type is a gear.
Script: With the help of a script task you can include your own scripts so this process step can run automatically. It is symbolized by a computer chip.
Tip
Further information about the usage of the different task types can be found in the user documentation of BIC Process Execution.
Note
In addition to the Task type, you also have the option of further typing your activities using the attribute selection fields Process type and Multiple Instance Type. With the Process type for example you can define a call activity. Through the function of Multiple Instances Type, you can, for example, mark activities as parallel multiple instances.
How do I change the event type in a BPMN diagram?
Select the event whose event type you want to change by a right click. Display the attributes.
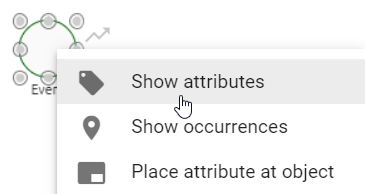
In the Event type attribute field, you can change the type as desired using a selection menu. To do this, click on the marked arrow. The changes are also noticeable at the object itself through different icons that show up. There are different event types available for the start, intermediate and end event, according to the OMG standard.
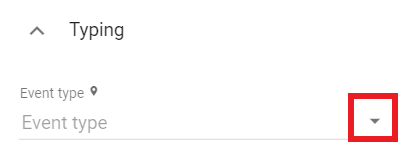
How do I attach an Intermediate Event to an Activity?
In BPMN diagrams you have the possibility to attach an intermediate event to an activity:
First, you need an activity. Then, drag & drop the intermediate event that you want to attach over the edge of the activity. The appearing orange edge means that you can attach the event to the activity. One half of the intermediate event is always placed inside the activity.
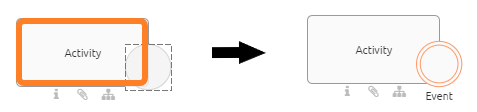
If you want to remove the intermediate event from the activity, simply drag & drop it back into the editor.
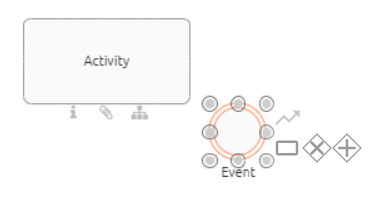
Note
When you move or change the size of the activity, the intermediate events remains attached to it.
DMN Editor
The DMN Editor allows Editors the option to add business rules to their diagram. Based on these rules, business processes can determine what action should be taken in different decision making situations. The simulation of the evaluation of the results can then be performed by all users in all stages and views.
Note
Decision tables can be created for objects of the type decision or for activities.
Where do I find the DMN Editor?
In the relevant diagram, navigate to the decision or activity for which you want to set rules. The object must be of the task type Business Rule. You can find the Task type in the Typing attribute group within the attributes of the corresponding object.
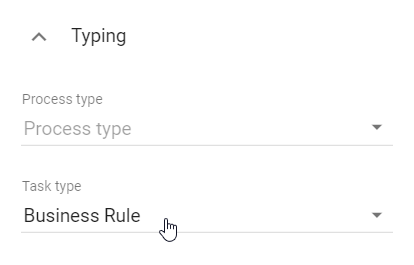
To run the DMN Editor, right-click the object to open the context menu. Select the entry DMN Editor.
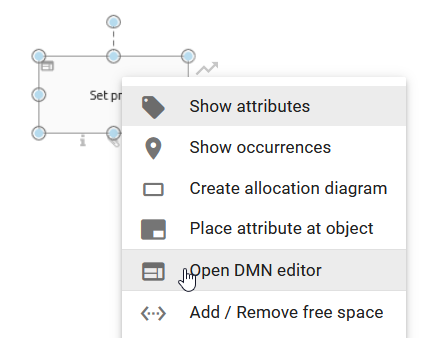
Alternatively, you can open the editor by selecting the activity and choosing Process Execution Editor from the Options. There you will find the Open editor button. Select it and the DMN Editor opens.
The DMN Editor opens in the form of a table. Here you can set and edit rules, input and output values. Alternatively, you can import entire decision tables. To return to your diagram, choose Save in the upper right corner if you want to save your changes. If you do not want to save your changes, select Cancel.
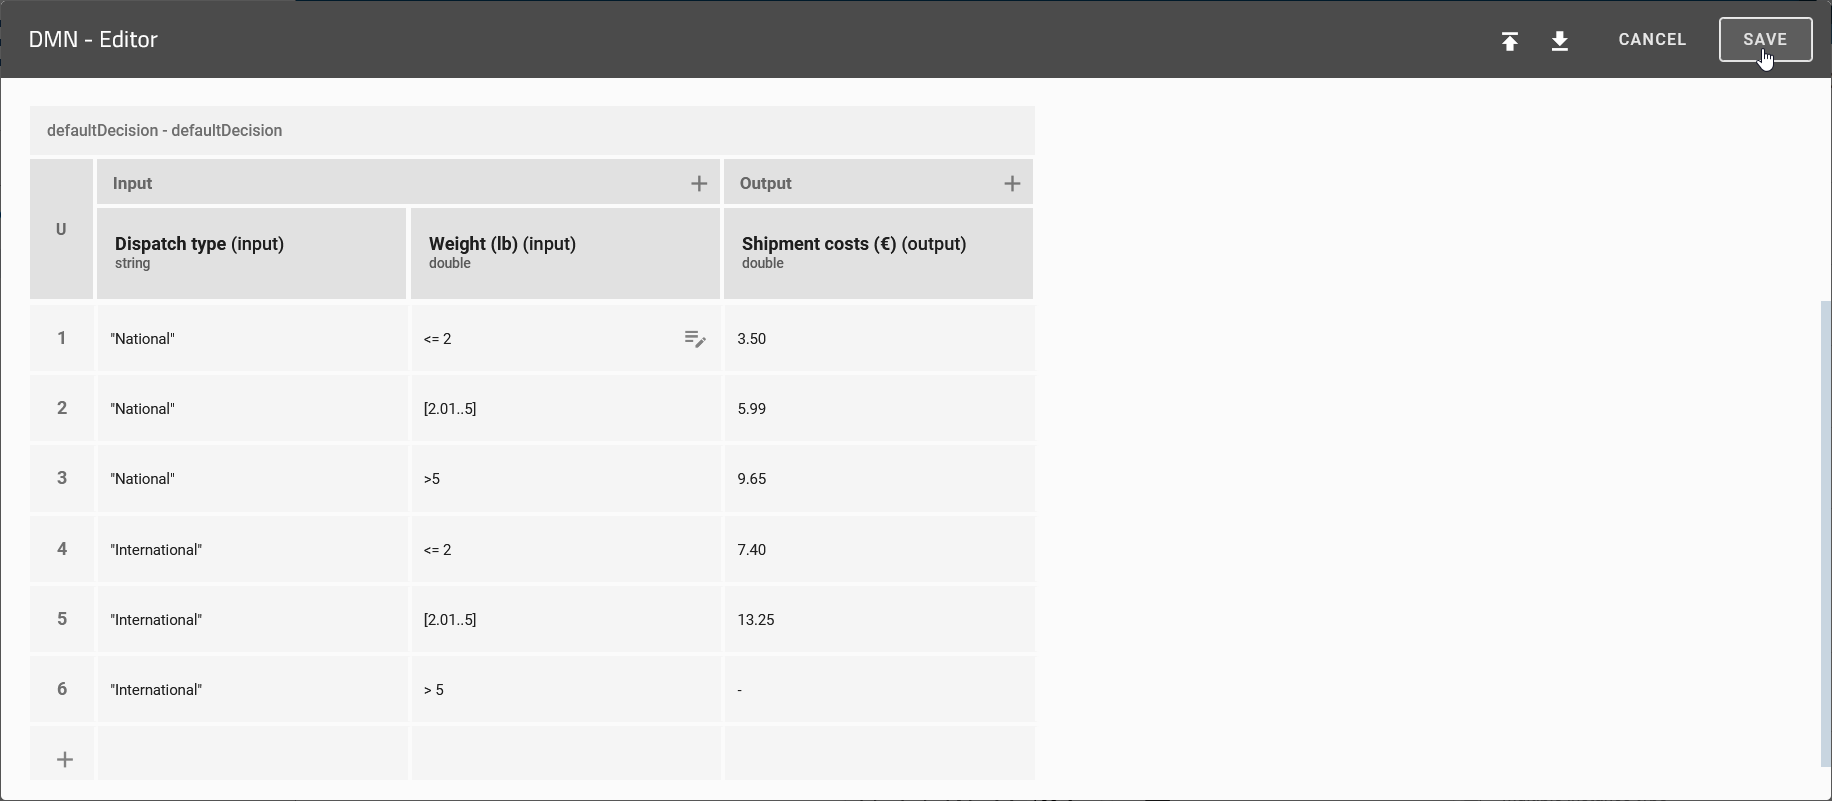
How is the DMN Editor structured?
The available functions of the DMN Editor are arranged in a table. The table can be divided into the following sections:
Hit Policy: Here you can see the selected hit policy.
Input/Output: The Input column contains all possible input values to be considered by the user. Similarly, the Output column shows the output values of the defined rules.
Rules: This section contains all decision rules that will later be used to evaluate the respective decisions.
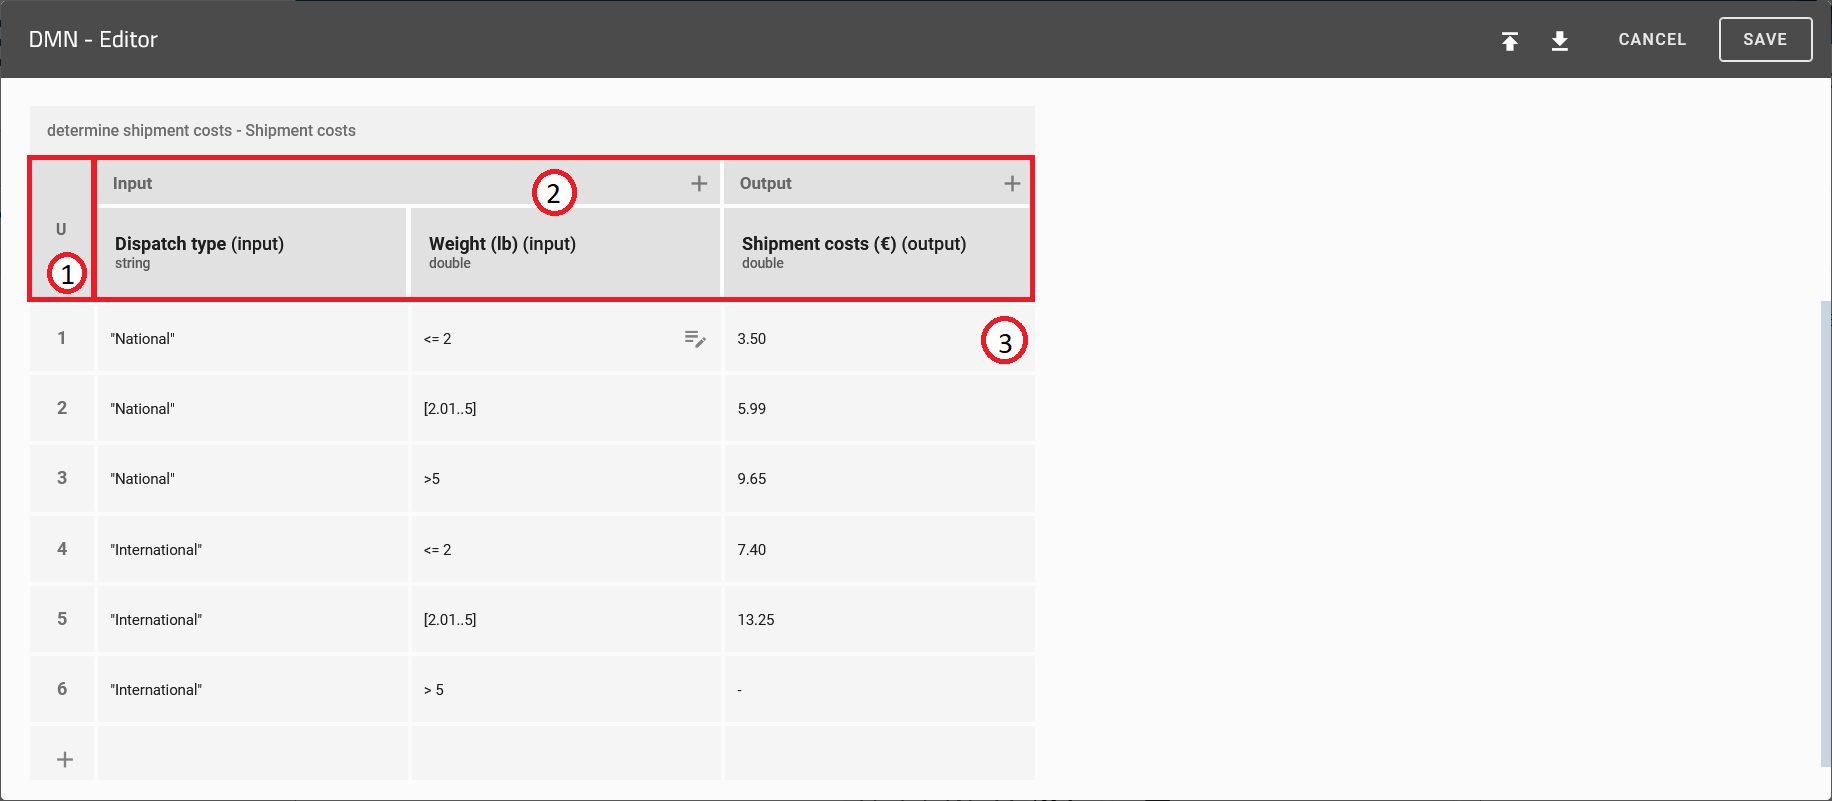
Figure: The DMN Editor can be divided in the sections hit policy (1), input/output (2) and rules (3).
How can I change the selected hit policy?
The hit policy lets you determine how your decision rules are executed. You can modify the policy by following these steps:
Navigate to the respecting business rule and open the DMN Editor. Then click on the field that displays the current hit policy.
A list of all available policies opens. Here you can select the desired hit policy.
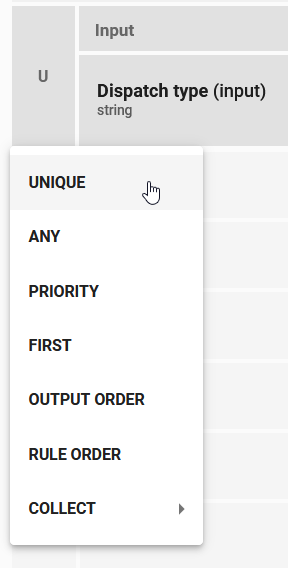
Which hit policies exist and how can I use them?
The DMN Editor allows you to create rules that can overlap. An example is shown below. Hit policies are used to determine what output should be returned.
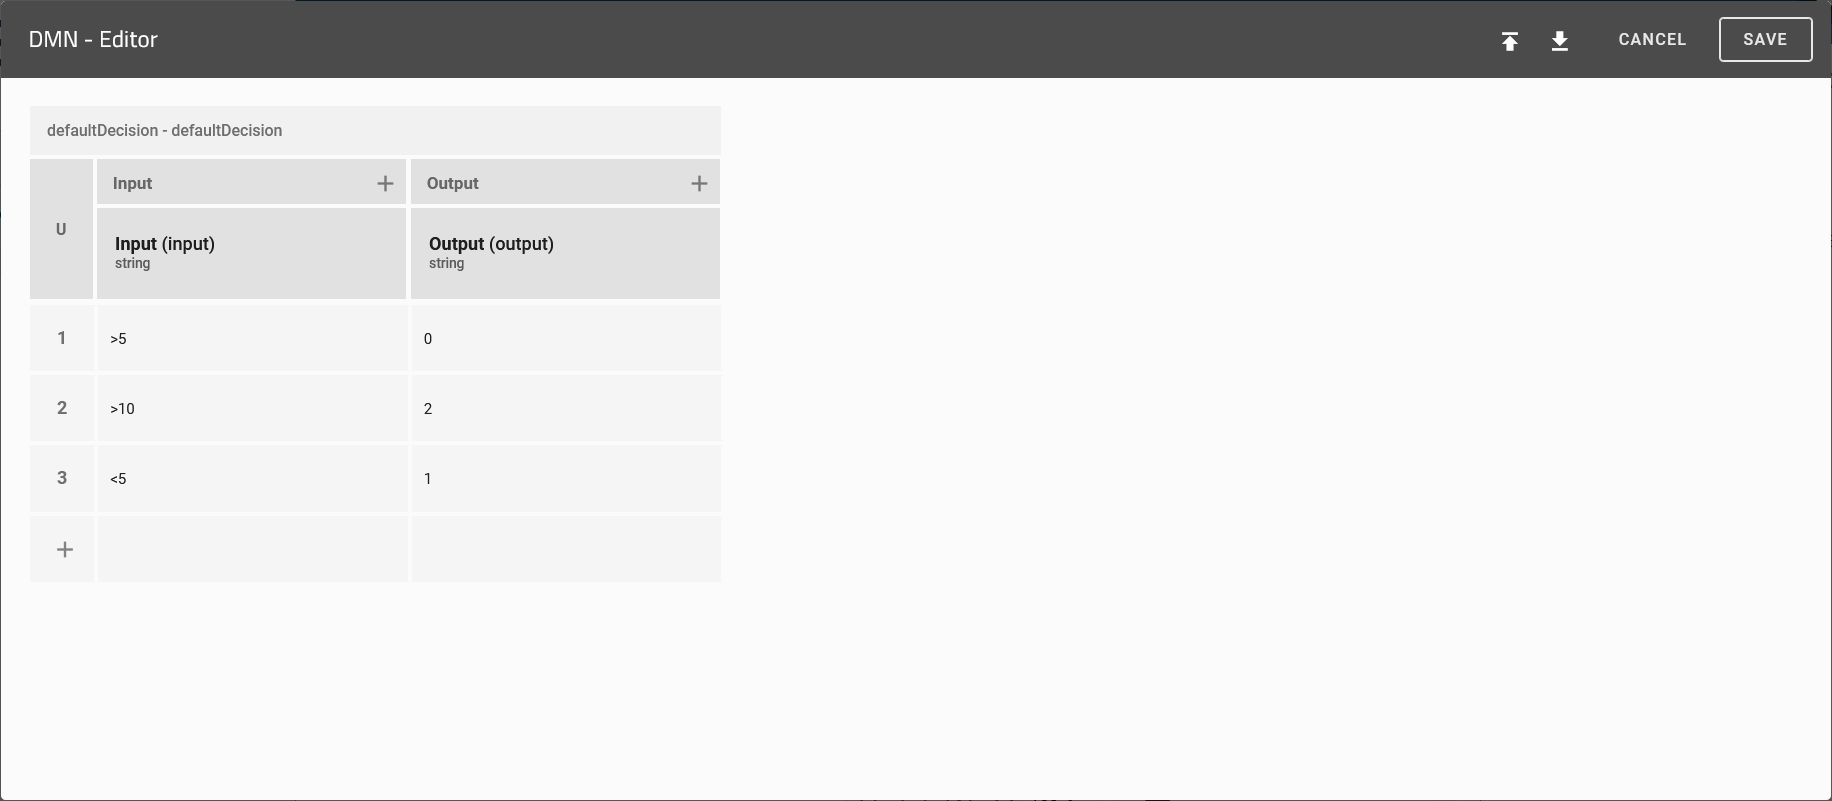
There are hit policies that return only one value and those that can return multiple values.
If you only want one output from your decision table, you can use the following hit policies:
UNIQUE: Rules are not allowed to overlap. Only a single rule can be matched and return its output.
ANY: Rules are allowed to overlap, but if they do, they will have the same output. Any match can be returned. If the outputs are not the same, an error will occur when using the decision table.
PRIORITY: This hit policy is currently not supported.
FIRST: Rules can overlap. If they do, the first rule that matches will return its output. This means that the order of the rules in the DMN Editor is important.
If you want to get more than one output, you can use the following hit policies:
OUTPUT ORDER: This hit policy is currently not supported.
RULE ORDER: All outputs of matched rules are returned in the order of the rules in the DMN Editor. This means that the order in the DMN Editor is important.
COLLECT: All outputs of matched rules are returned in any order. Optionally, you can add an operator to manipulate your result:
no aggregation: All values are returned.
sum: The sum of all numeric outputs are returned.
min: The smallest value of all numeric outputs are returned.
max: The biggest value of all numeric outputs are returned.
count: The number of rules matched are returned.
How do I add input and output values to my decision table?
If you want to use additional input or output values for your decision rules, you can add them to your decision table by performing the following steps:
Open the DMN Editor of the respective activity.
Click on the plus button next to Input or Output in the “Input/Output” section to add a new input or output value to your table. The new input/output value will appear in the corresponding column.
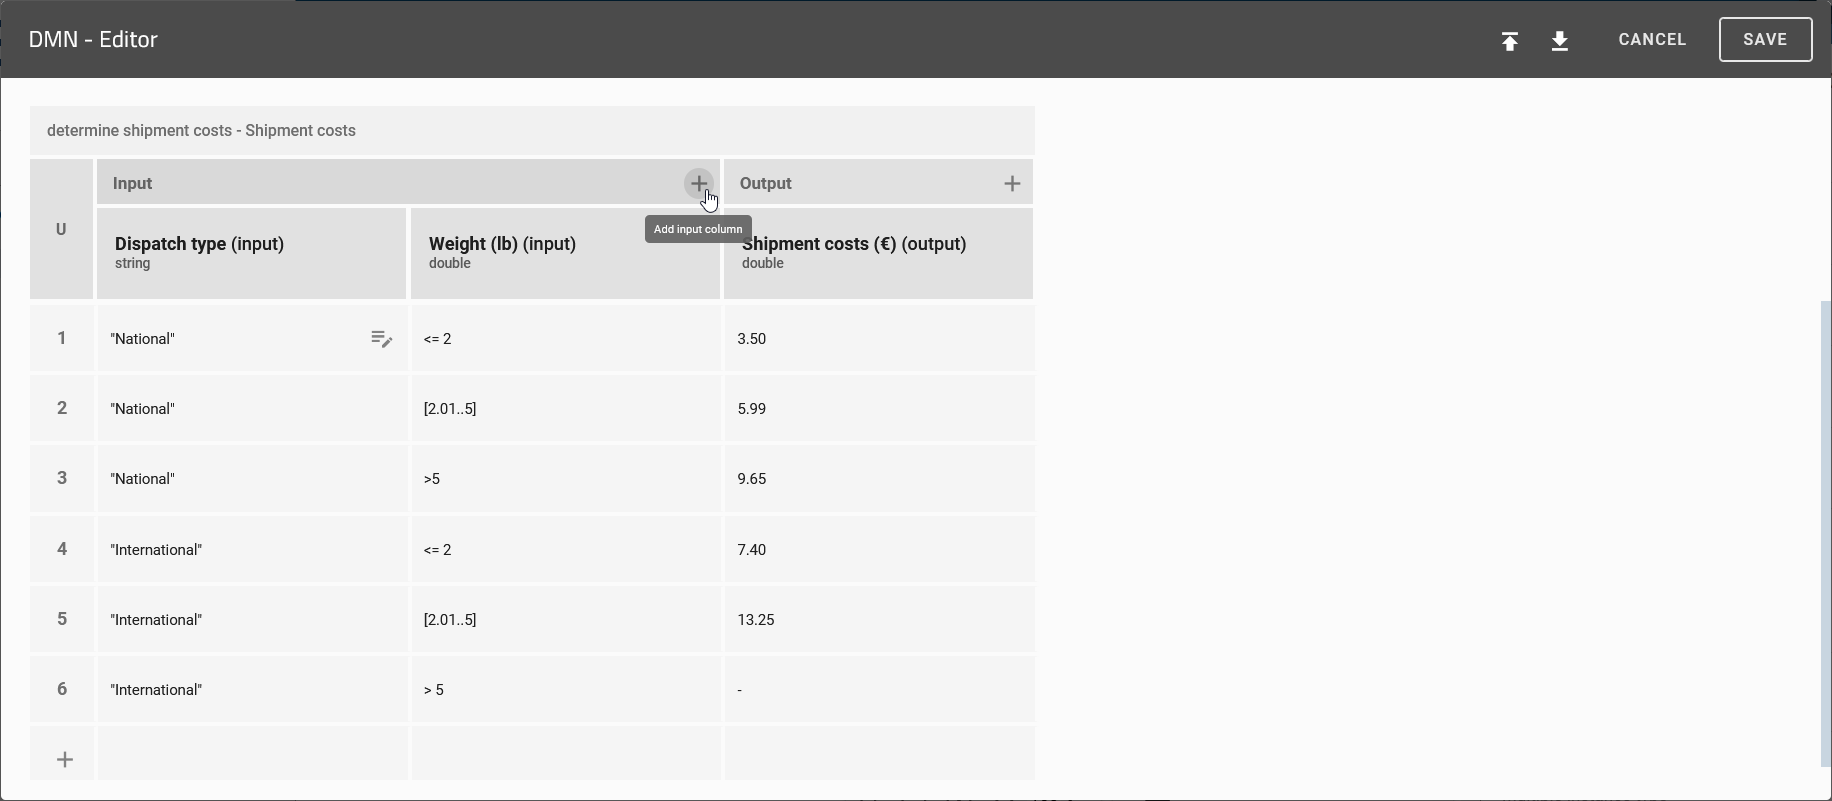
How can I edit the input values?
Within the decision table, you can edit the properties of your input values for all decision rules. To change these properties, open the DMN Editor of the desired object and then click on the input value in the “Input/Output” section. A dialog opens where you can adjust the selected input value.
You can edit the following properties:
Label: Here you can specify the name under which the respective input value will be displayed in the object’s attributes. If you do not specify a label, it will be generated automatically (e.g. Input 1).
Input variable: As soon as you evaluate input values, they are stored in variables. These should have a unique identification for further processing by the DMN engine. The identification is defined in the Input variable property. Be aware that only a combination of the following characters is allowed for the value of the Input variable: lowercase and uppercase letters, underscores, and numbers. Numbers are only allowed as a following character. If no value is set, the DMN Editor automatically generates a value. This generated value is based on the given value set in the Input label property. You also can use predefined process variables here.
Expression: This property allows you to define expressions for each input value. As a result, the input values of the decision rules can be additionally specified and modified.
Data type: Use the drop-down menu to specify the data type for each input value. You can choose from the following data types: string, boolean, integer, long, double and date.
Predefined values: You have the following options for input values of type String: Enter strings in the Define new value field and add them to the list of predefined values by clicking the plus icon. Existing list entries can be deleted using the trashcan icon. Finally, this list serves as a suggestion list of possible input values for the evaluation of the decision. The predefined values can therefore reflect the cells entered in the “Rules” section for the respective input. Be aware that this list is only a suggestion list. Users can still enter different input values.
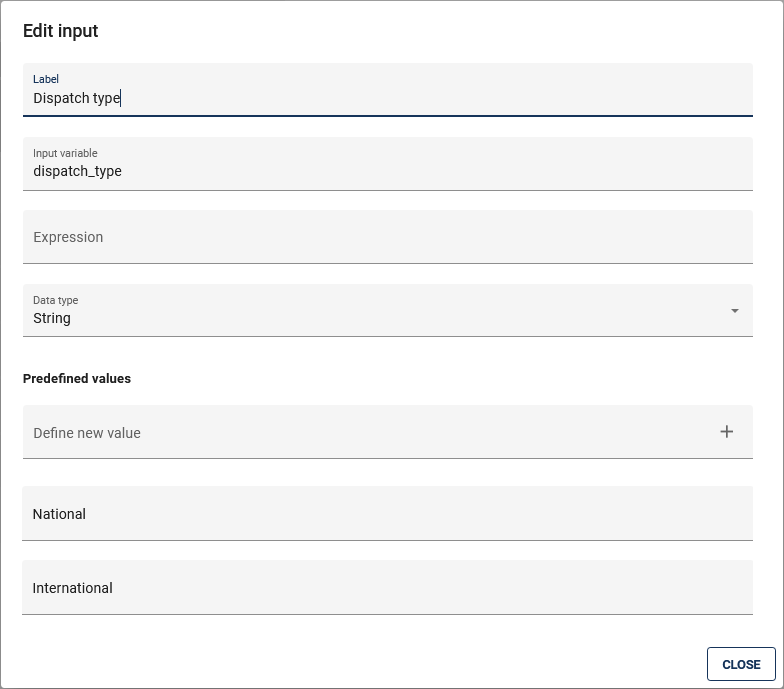
After you have completed your changes, you can save them by clicking the Close button.
Note
You can use the variables defined here in other activities, e.g. as a process variables in BIC Process Execution.
How can I edit the output values?
Within the decision table, you can edit the properties of your output values for all decision rules. To change these properties, open the DMN Editor of the desired object and then click on the output value in the “Input/Output” section. A dialog opens where you can adjust the selected output value.
You can edit the following properties:
Label: Here you can specify the name under which the respective output value will be displayed in the object’s attributes after the evaluation of the input values.
Output variable: As soon as you evaluate the decision rules, the output values are stored in variables. These should have a unique identification for further processing by the DMN engine.
Data type: Use the drop-down menu to specify the data type for each output value. You can choose from the following data types: String, Boolean, Integer, Long, Double und Date.
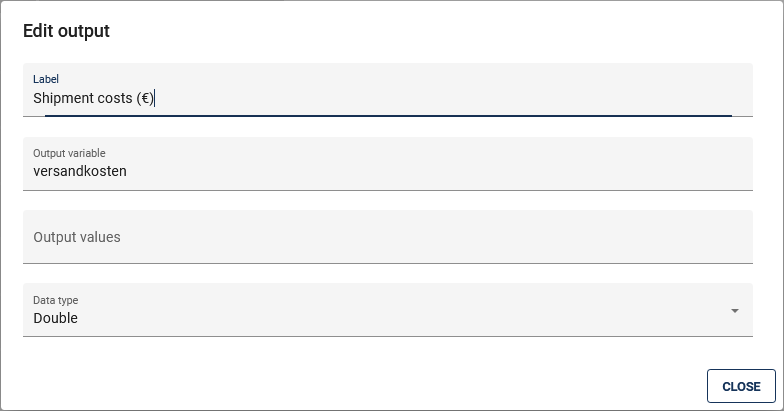
After you have completed your changes, you can save them by clicking the Close button.
Note
Possible functions of the property Output values are currently not supported.
How do I delete input and output values from my decision table?
To delete an input or output value, follow these steps:
Open the DMN Editor for the respective activity. Select the Delete column option for the column you want to delete. This option is indicated by a trash can icon.
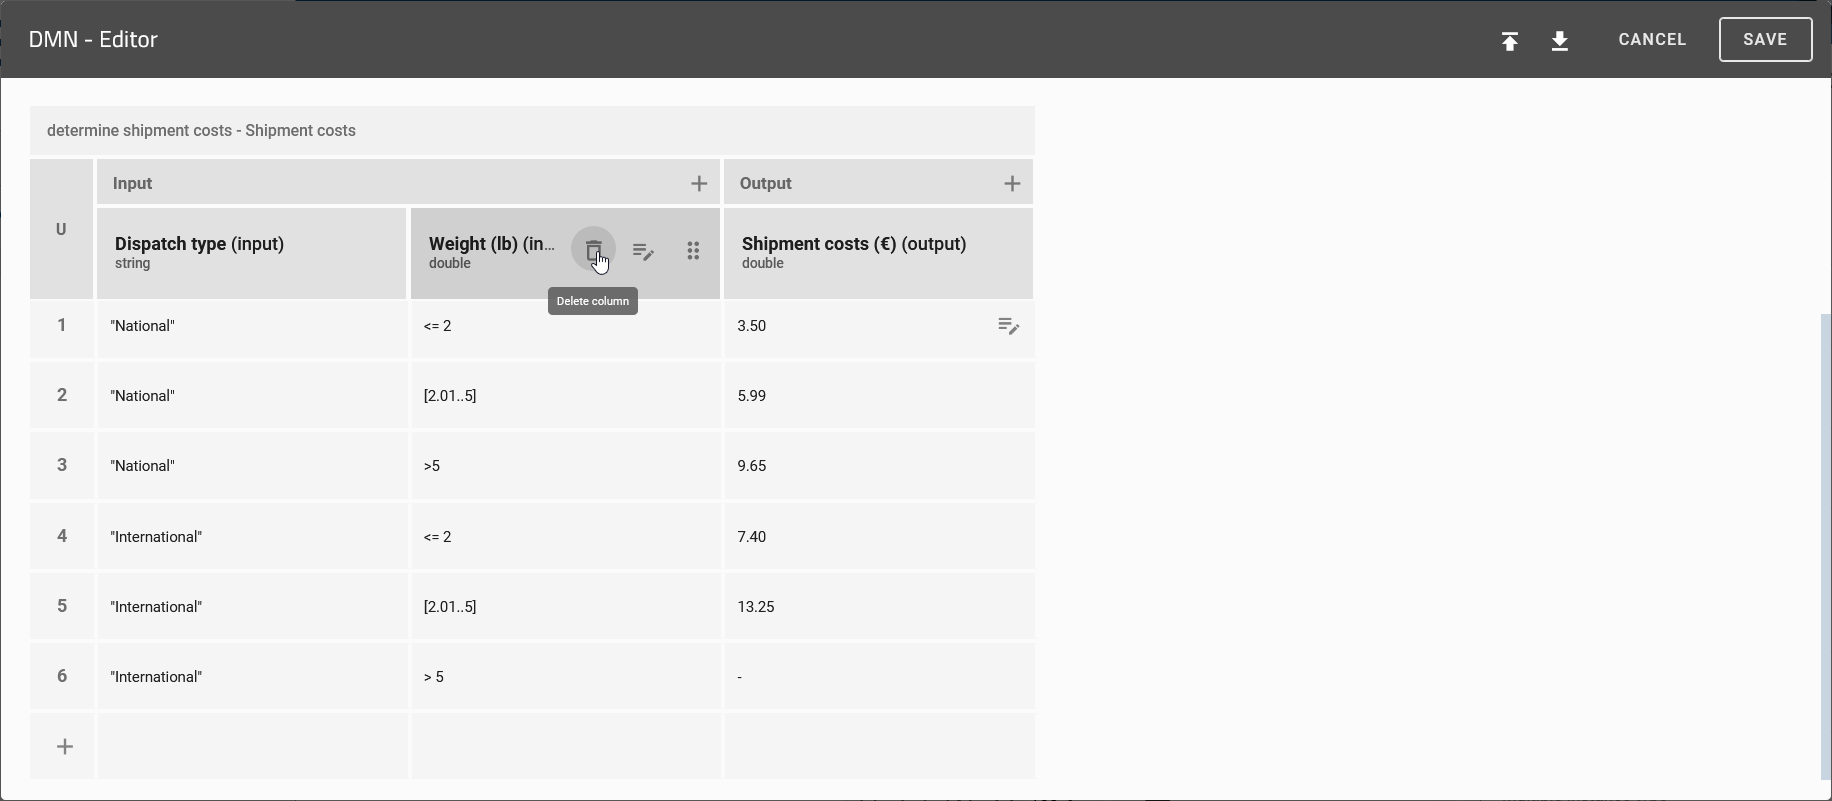
Note
Note that there must always be at least one input or output value for each decision table. For example, if there is only one input value, it cannot be removed from the table.
How do I administrate my decision rules?
In the “Rules” section of the DMN Editor, you will find all the decision rules for this decision. Each row represents a rule. It is defined by the specified input and output values. You can change these values by clicking on the cell containing the value you want to change.
You can use the following functions to administrate the the decision rules:
Add row
You can add a new rule to your table by clicking the plus sign below the last row.

Duplicate row
For ease of use, you can duplicate entire rows. To do this, click on the number of the rule you want to duplicate and select Duplicate from the context menu.
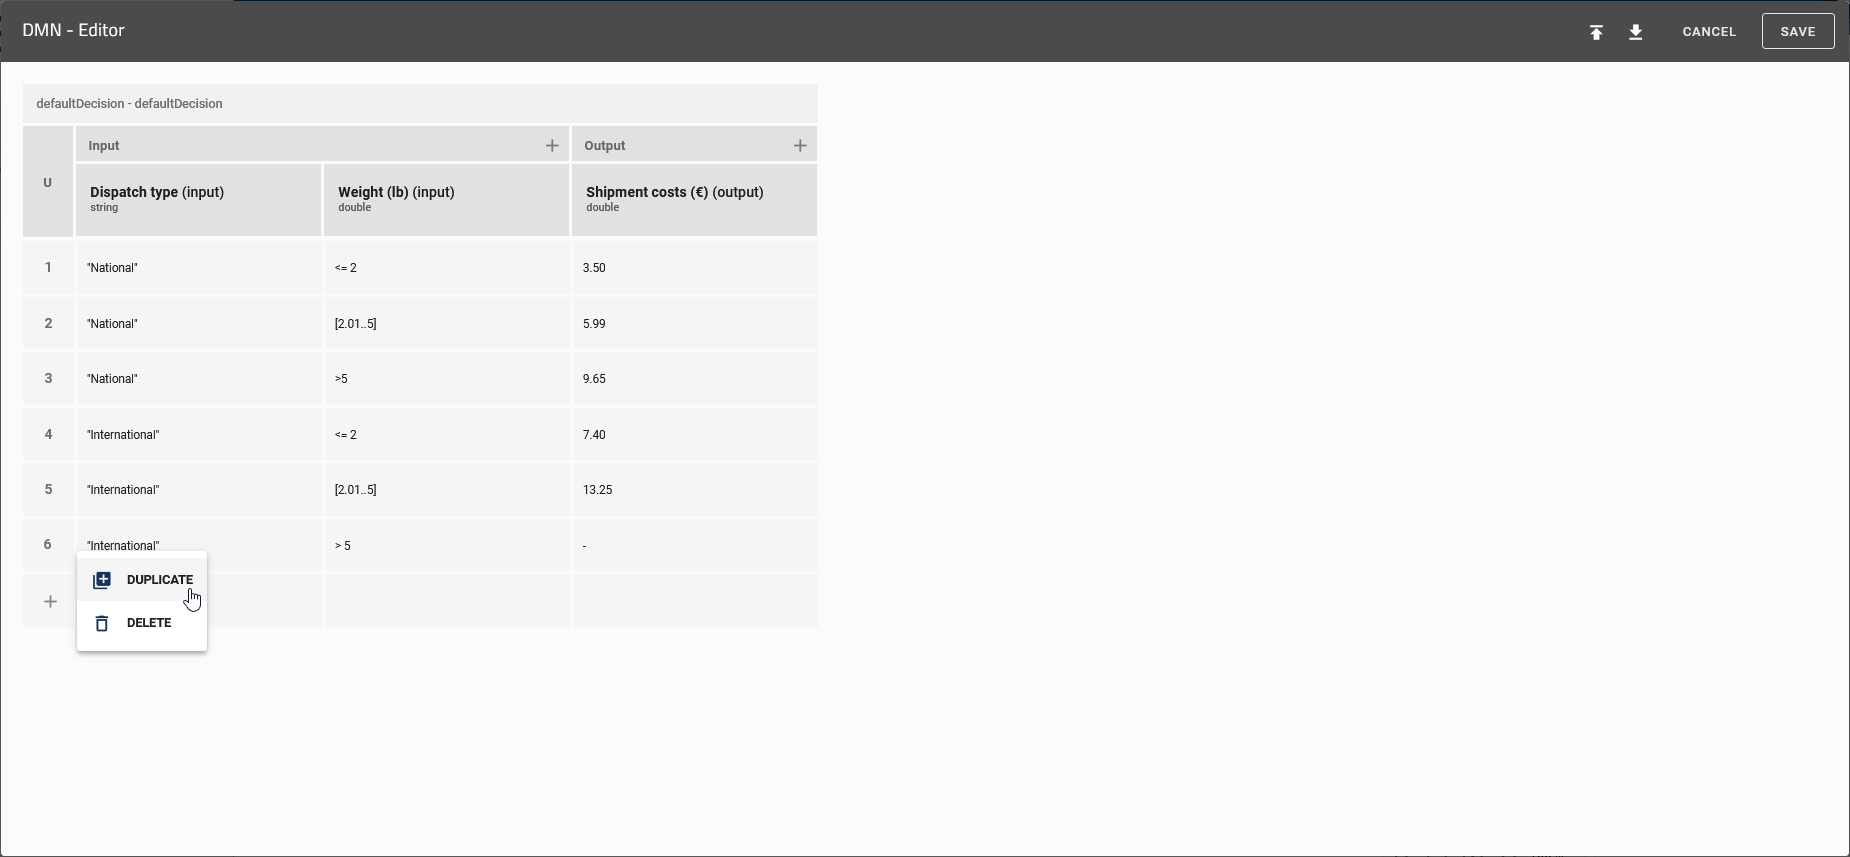
A new rule will be created under the selected row. The new rule will have the same values as the selected one.
Delete row
To delete a rule, click on the number of the corresponding row and select Delete from the context menu. The row will disappear from the table.
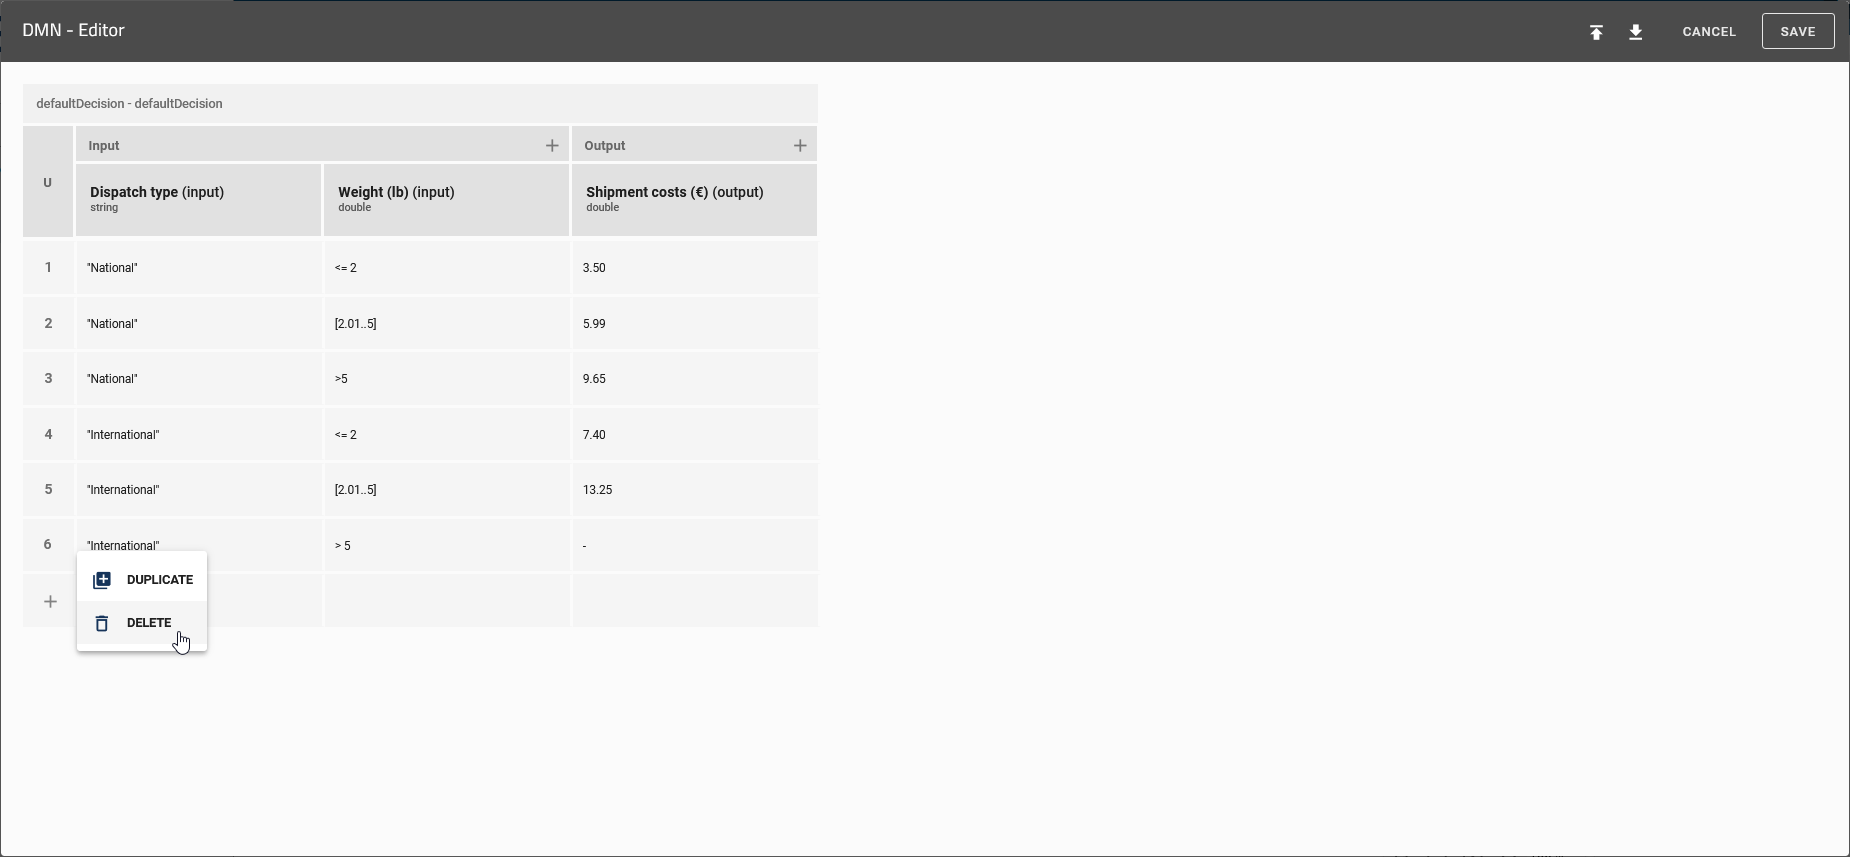
Note
The semantics of the defined values are based on the DMN standard FEEL (“Friendly Enough Expression Language”).
Where can I use the decision tables?
To use a decision table, navigate to the options of the respecting object and click on the Decision button.
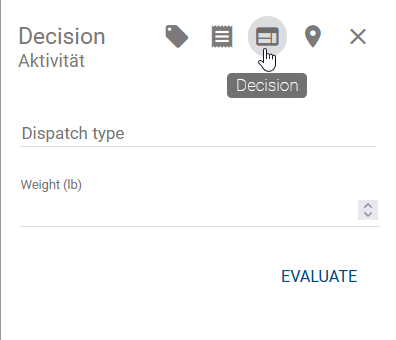
Here you can specify the specific input values. If predefined values have been previously maintained, a suggestion list is displayed when you click on the corresponding input field. Click Evaluate to start the evaluation. The results are displayed below the input values.
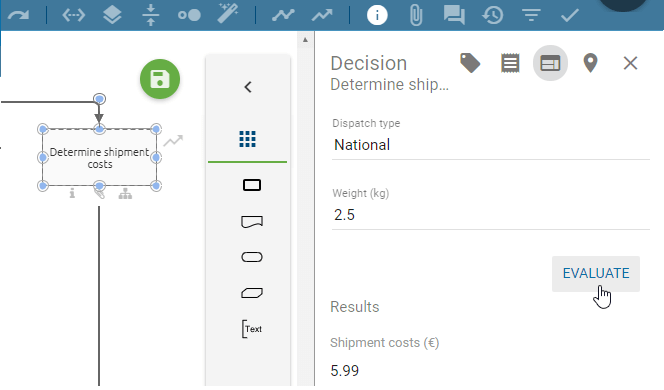
Note
Please note that the simulation of the evaluation of the results can be performed by all users in all stages and views.
Note
When entering the values in a text field, pay attention to the capitalization!
Note
Please note that the simulation of the evaluation of the results can be performed by all users in all stages and views.
How can I import/export decision tables?
You can use the DMN Editor to import existing DMN tables or export DMN tables from BIC Process Design. Both options are described below. Open the DMN Editor for the activity.
Select the Import or Export option.
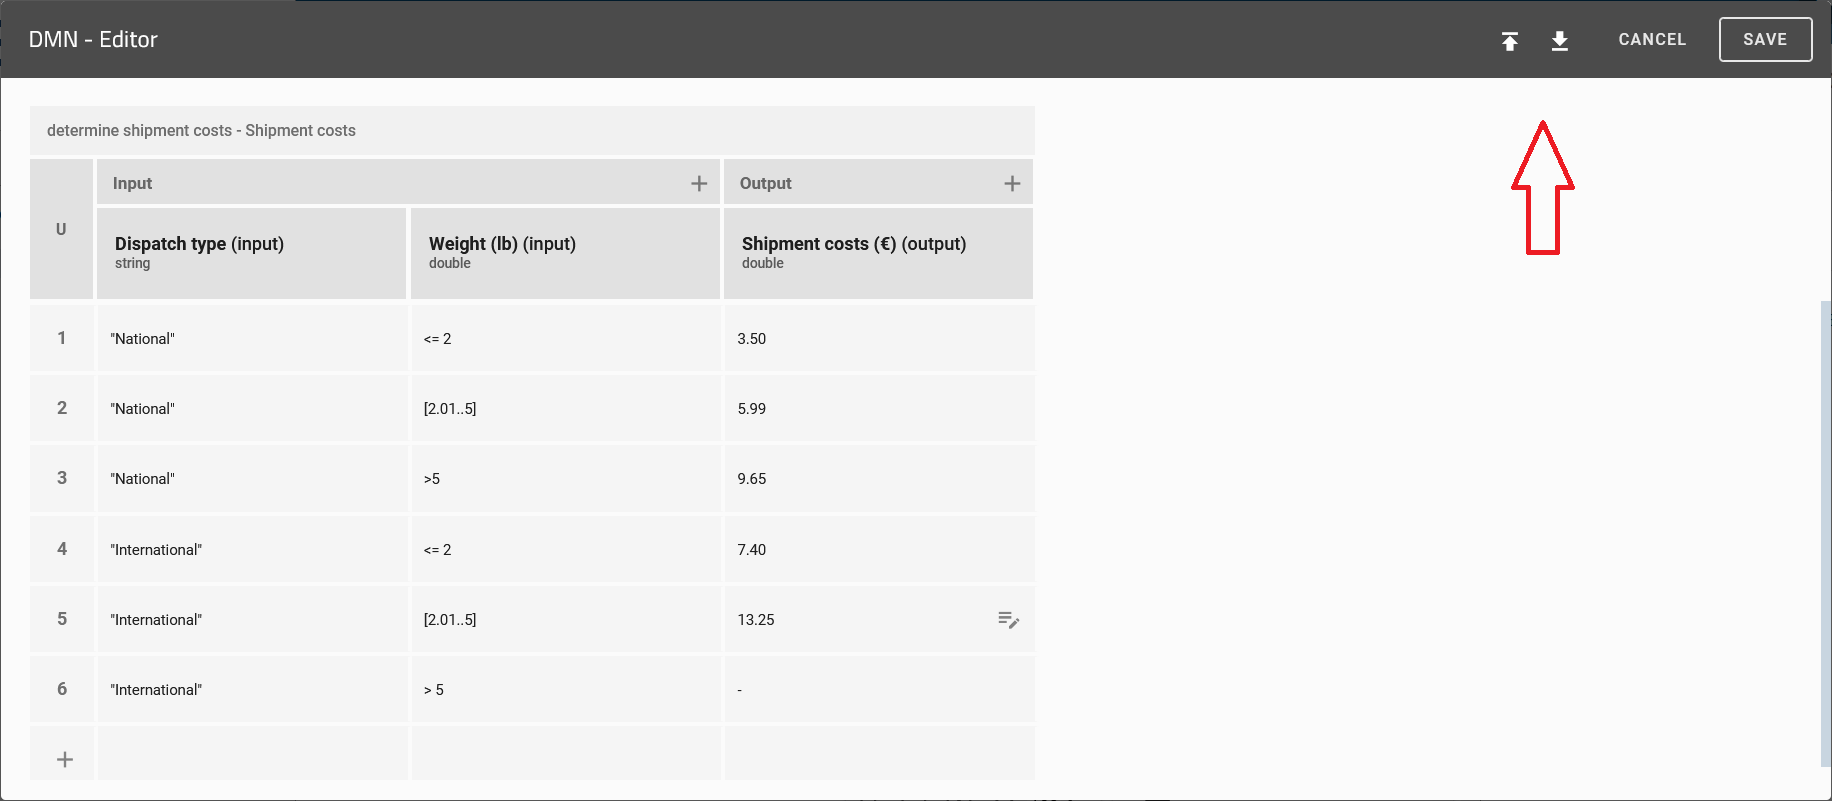
Import
If you select the Import option, a dialog opens where you can select the desired file. By clicking on Open, the file is imported.
Note
Note that the file, which should be imported, must be a .dmn file.
Export
Select the Export option. Your table will be exported as a .dmn file and automatically downloaded.
Validation
How can I validate my modeling?
You can determine whether your modeling is valid for the settings selected by the administrator. To do this, open the Validation through the options on the right side.
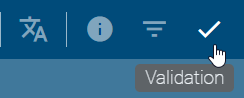
You can see a list of unapproved or not published catalog items regarding this diagram or entities for which check-in is prohibited in the right sidebar. If OCL rule violations or invalid sequence flows are existing in the diagram, the corresponding list is displayed here, too. In addition, catalog items will be displayed if their Valid to date is reached. In the diagram, when clicking on a list entry, the associated symbols are highlighted in color. Furthermore, you can collapse the lists by clicking on the list header, which also shows the number of entries. At the top right you can Close the validation bar.
How do I handle not allowed catalog suggestions?
As long as some inadmissibility is displayed in the validation list Not allowed catalog suggestions, you will be not able to check in the diagram. The affected symbols that are additionally marked red in the validation should therefore be linked to an existing catalog items via the suggestion list. If no suitable catalog item exists, you can remove the symbol from the diagram. On the other hand, users can create a suitable new catalog item with the rights of an editor. As soon as no more inadmissibility exists after saving, check-in is possible.
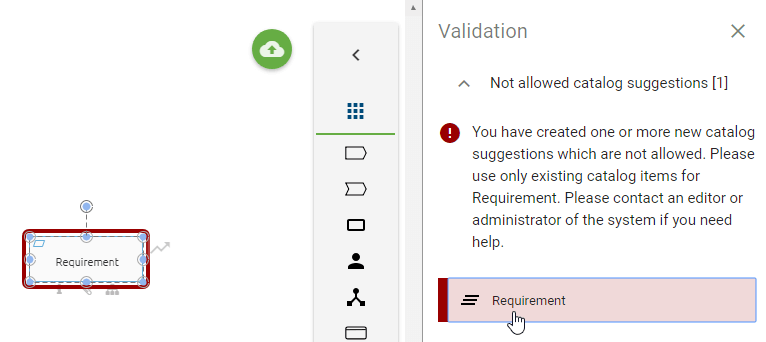
Note
Users who have the appropriate permissions can still create objects in the catalog for reuse in diagrams.
How do I deal with unapproved catalog suggestions?
In the validation you can see the list Used catalog suggestions. Entities in the opened diagram are listed here if they are not yet accepted in the catalog. This applies to newly created, existing symbols or symbols that are linked to catalog items via attributes. When the validation bar is open, modeled entities are listed in yellow and marked in the editor by clicking on the entry. Entities, that are accepted in the catalog but are linked to unaccepted entities in the attributes, are also marked. It is indicated by the addition Object attribute in the list entry. If this behavior also occurs in the diagram attributes, the listed entity is labeled with Diagram attribute.
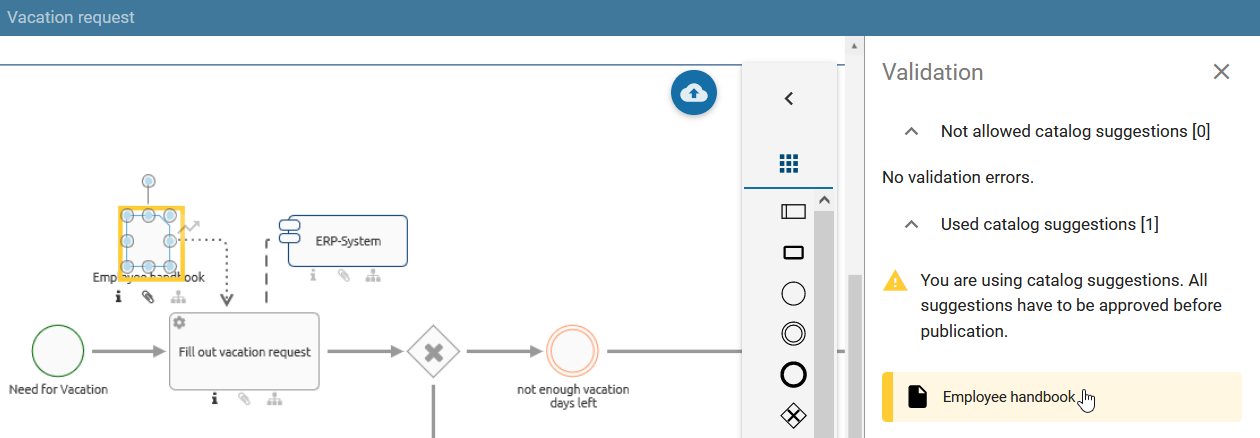
Check-in is not restricted by this feature. However, before publishing the diagram, the catalog suggestions listed here should be approved in the catalog. You can also do this in the option Validation of a checked-in diagram in the public workspace, using the Approve option to the right of the catalog item that has not yet been approved.
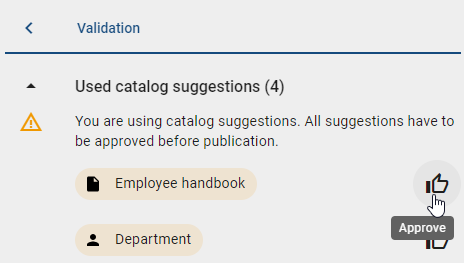
How do I deal with unpublished catalog suggestions?
In the validation, you can see the list of Not published catalog items. Entities of the selected diagram are listed here if they have their own responsible person (lifecycle) but have not been published yet.
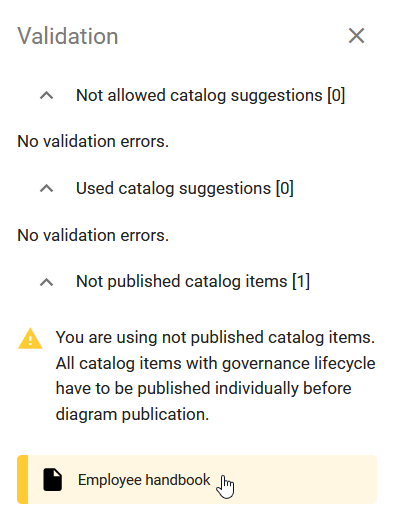
This applies to newly created, existing symbols or symbols that are linked to catalog items via attributes. When the validation bar is open, modeled entities are listed in yellow.
The diagram can only be published in BIC Process Design once all contained catalog items with their own life cycle have already been published or their publication has been initiated. Users with author rights can publish the catalog items in the catalog. Alternatively you can do this in the option Validation of a checked-in diagram in the public workspace, using the Publish option to the right of the catalog item that has not yet been published.
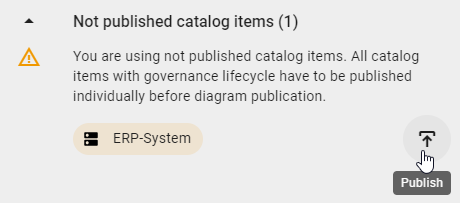
If the catalog items are in the preview stage but not confirmed by the person responsible, the diagram will be published containing a draft version of that catalog item. After confirmation the draft version is automatically replaced by the final version.
How are OCL rule violations displayed?
The OCL (Object Constraint Language) is supported on the method side and is also used for validating the model. This allows you to set various modeling restrictions that help users to design valid diagrams. Rules defined with OCL for modeling are checked during modeling and/ or afterwards (during check-in). Rule violations are displayed in the validation mode sorted by severity and can be defined in the method with appropriate notes for the modeler. Both connected and unconnected modeling objects can be validated. By clicking on the list entry in the validation, the corresponding object is marked in the diagram.
For example, in BPMN collaboration diagrams, this prevents a diagram from having missing mandatory attributes. In this case, the responsible person has not been maintained in the diagram attributes. This is not allowed by the method and is displayed as follows during validation.
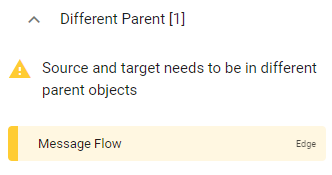
Moreover, OCL rules concerning diagram attributes, so called semantic checks, can be defined in the method. Depending on the setting, the check is done when the diagram is modeled or when it is checked-in. For example, semantic checks can be useful to ensure that modellers always maintain a specific diagram attribute or set a meaningful validity period. If you model a diagram and a semantic check fails for a diagram attribute, you will be informed about it in the validation hub. The hint is - depending on the concerning method setting - either a warning (yellow), an error (red) or a blocker. If a modeled diagram violates a blocker, the check-in is not possible. You need to correct the modeling to be able to transfer the diagram from your local storage to the public workspace via the check-in.
Hint
Please be aware that users who utilize customized OCL rules do not receive the diagram attribute checks automatically. They need to integrate these manually into their customized method.
In the method of the following example, a rule has been defined which states that the attribute scope (AT_SCOPE) of a BPMN diagram should be maintained. In case of a violation, a customized message will be shown. A violation of this rule is estimated as a warning. Thus, the following warning hint is displayed to the modeller of the diagram “Vacation request” because the scope attribute is empty.
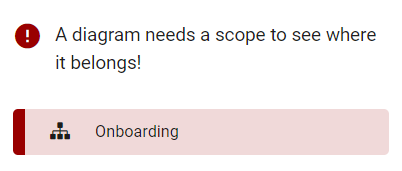
OCL rules can be adjusted in customizing.
How is an invalid sequence flow displayed?
In the validation of BPMN diagrams, objects with invalid sequence flows are listed under the heading Sequence flow, if these exist in your modeling. In the following cases you will receive a corresponding note in the validation bar:
Intermediate events have no incoming and/or outgoing sequence flow
Activities have no incoming and/or outgoing sequence flow
Start events have no or more outgoing sequences
End events have no or several incoming sequences
Gateways have several incoming and outgoing sequence flows simultaneously
Gateways have exactly one incoming and one outgoing sequence flow
As an example, the message for an end event without an incoming sequence is displayed here.
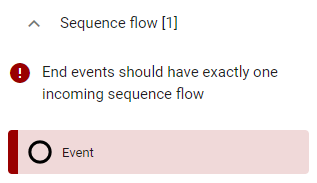
Allocation diagrams
Allocation diagrams allow you to add subgraphs to the main graph of your diagram. By using these allocation diagrams you can model subdiagrams in a manner, so that your main diagram is not overloaded with details.
Note
Allocation diagrams can only be created for activities because the resources used in this activity are represented in this diagram type. A diagram can contain multiple allocation diagrams, depending on the number of existing activities.
How can I create a new allocation diagram?
Open the context menu of the corresponding activity by right-clicking on the symbol. Select the option Create allocation diagram.
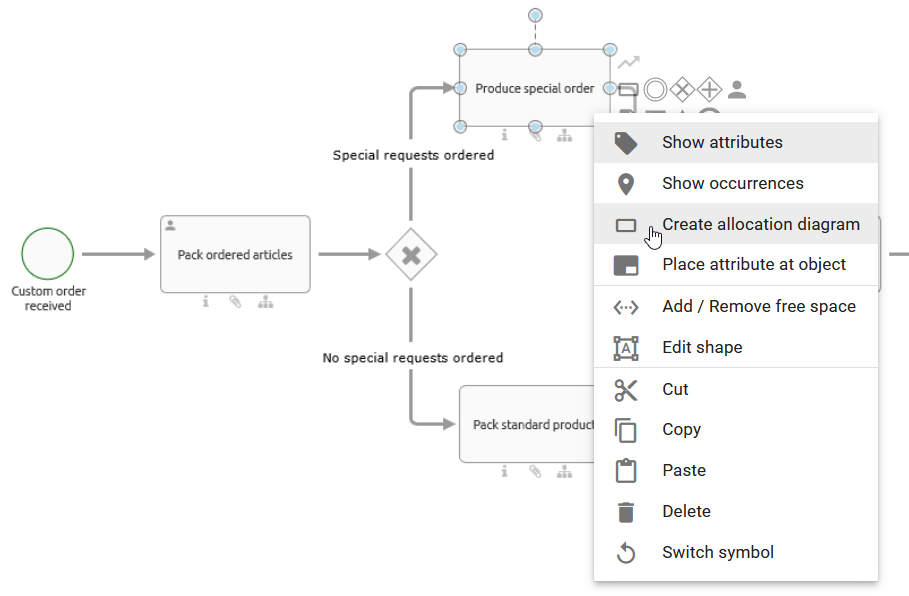
You will get to the editor of the allocation diagram where you will find the symbol of the respecting activity. Within this editor you can now model as usual.
If you want to return to your main diagram click on the Return to main diagram button on the upper side of your editor. When changes have been made you must save first before you can use the Return to main diagram function. You will then see the main diagram at the same position with the same zoom settings as before and the corresponding activity is selected.
Note
Only one allocation diagram can be created per activity, as this ensures a clear assignment.
How can I edit an allocation diagram?
To open an allocation diagram for editing you have the following possibility:
Check-out the diagram in which the associated allocation diagram is located. Open the context menu of the corresponding activity by right-clicking on the symbol. Select the option Open allocation diagram.
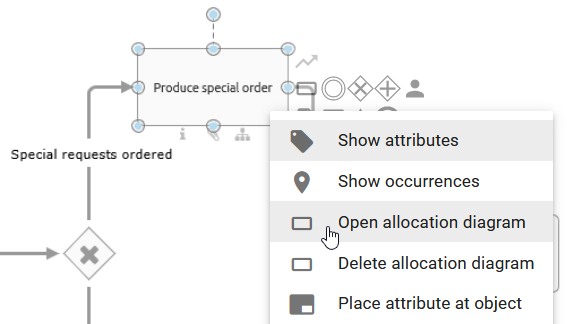
To apply the changes, click on the Save button on the upper side of your editor after editing your allocation diagram.
Note
Symbols created in the allocation diagram are only displayed there. Changes you make to the activity for which the allocation diagram was created are visible in the main graph and also in the corresponding allocation diagram. It does not matter if the changes have been made in the main diagram or the allocation diagram itself, or if there is a catalog item for this activity. Note that it is not possible to edit an activity with an allocation diagram using the suggestion list.
How can an allocation diagram be deleted?
To delete an allocation diagram execute the following steps:
Navigate to the diagram in which the the associated allocation diagram is located. Then, open the context menu of the corresponding activity by right-clicking on the symbol. Select the option Delete allocation diagram.
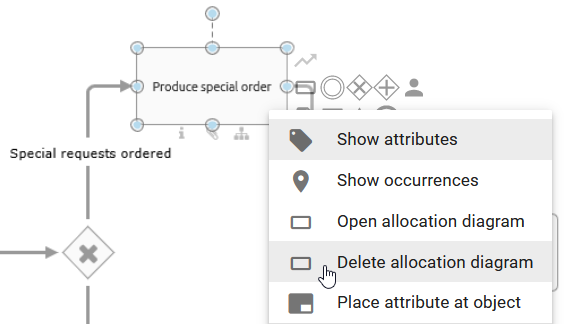
The allocation diagram has been removed and is no longer displayed in the explorer under the corresponding diagram.
How can I recognize if an allocation diagram has been assigned to an activity?
Users with the Author role can create allocation diagrams for activities if the author is maintained in the diagram’s Author attribute. For both checked-out and checked-in diagrams, you can identify from an activity whether an allocation diagram has already been assigned to it.
To do this, open any diagram from the Diagrams menu item in the left menu bar. For activities with an assigned allocation diagram, the diagram symbol below to the right of the activity is highlighted in black.
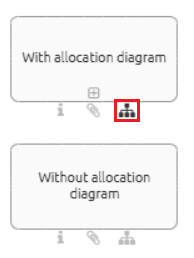
This symbol also indicates if other diagrams (variants, subprocesses, FAD) are assigned to the activity. When clicking on the diagram symbol in both checked-in and checked-out diagrams, you will be navigated to the assigned diagram if only one diagram is assigned. If multiple diagrams are assigned, a list of all assigned diagrams will be displayed.
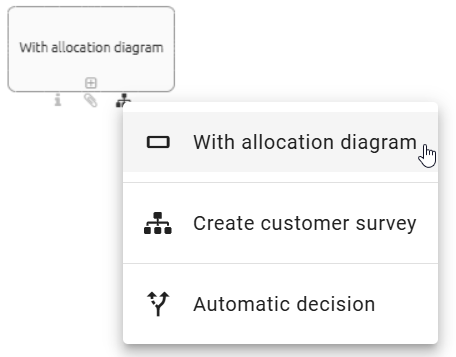
After that, you can navigate to the corresponding diagram.
What are external function allocation diagrams (FAD) and how can I use them?
External function allocation diagrams (FDA) are analogous to allocation diagrams diagrams, which you can allocate to activities in order to describe a subordinated part of your diagram more precisely. Unlike the allocation diagrams, external FADs are not created via the context menu of an activity. An external FAD is an already existing diagram which is assigned to an activity in another diagram using the Allocation model attribute.
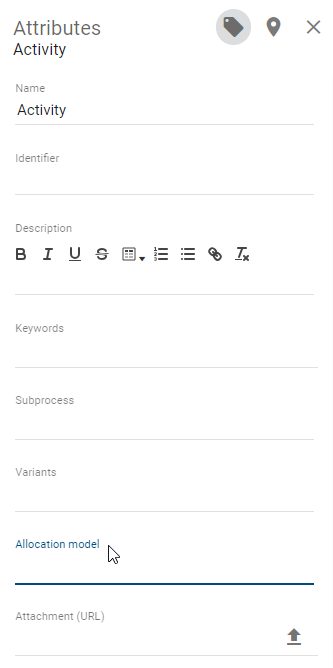
Analogous to the subprocess, simply link a diagram to an activity within its attribute Allocation model in order to assign the diagram to the activity as an external FAD.
The external FAD continues to exist as an independent diagram, which can also be seen from the arrangement in the repository.
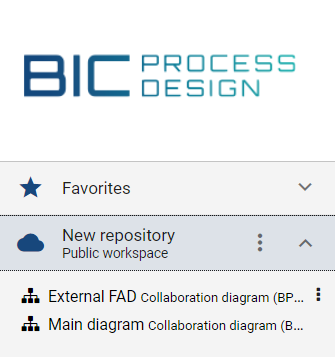
However, analogous to the allocation diagram, all relevant objects of the external FAD are also listed in the reports of the diagram that contains the relevant activity with the assigned FAD. In addition, by simply clicking on the external FAD in the activity’s attributes, you are automatically directed to the relevant diagram.
Note
Only one FAD can be created per activity, as this ensures a clear assignment.
Multilingualism
How can I model multilingually?
You can model diagrams in BIC Process Design in several content languages being supported by the alternative language. Translations of the content can be maintained within the diagram view or in the translation mode. In general, translations of existing objects that have already been accepted in the catalog should not be edited in the diagram view. If you maintain those changes directly in the diagram, new catalog items are created. The alternative way is to use the Diagram translation mode. Alternatively, you can use the Catalog translation mode.
Tip
For a clear view, which gives you a conclusion about which values have been maintained for which language, use the concerning translation mode. The chapters explaining these tools are linked above.
For direct changes within the diagram view select the content language you want to maintain the translation for. As alternative language, set the one for which the attributes have already been maintained.
Open your diagram in the designer. Now you can edit the corresponding attributes.
While editing, you can only see values of attributes that have been maintained for the selected content language. Therefore you can directly see if an attribute has not been translated yet.
If you set a value for a language and the viewer sets this language as his alternative language, he will see this value in case the concerning attribute has not been maintained in his content language. This is marked by the abbreviation of the alternative language in brackets after the value.
Note
If you change an attribute which has only been maintained in the alternative language, this change only applies to the content language. If you only use one language, the content language equals the alternative language. Note, that some attributes are independent of the content and alternative language such as the email address.
Hint
Please note that when switching to the alternative language, process names, descriptions and forms are displayed in this language if a translation is available. Otherwise, the content remains in the original content language. The user interface and system messages remain unchanged and continue to be displayed in your browser language.
How do I translate a diagram?
When modeling diagrams, modelers can directly maintain the corresponding translation for the content languages selected in the administration. The navigation to the catalog is not necessary.
Navigate in a checked-in diagram through the options to the Translation mode. All elements of the diagram that have at least one maintained text attribute are listed here. In addition to the diagram itself, all modeled symbols can therefore be included. Several versions of the same catalog item are therefore listed several times. The diagram is always the first list entry. Below, the objects are grouped alphabetically according to their object types. The objects of each group are also sorted in alphabetical order depending on their object names in the current content language. If the name attribute is not maintained, you see the object type instead.
Click on a list entry to expand it and see all text attributes of this entry in the available content languages. The attribute type names are displayed in the UI language. You can now maintain your translations in the text fields.
Click on Save changes and then on Leave to save your changes and return to the diagram view. Note the hint on top of the list. As administrator and editor, your changes to catalog items will ne applied immediately. If you are an Author, your list will be filtered, so that the accepted catalog data used in the diagram is not listed and cannot be changed here.
If you do not want to apply your changes, you can click on Discard changes oe click Leave without saving and select Leave in the appearing dialog.
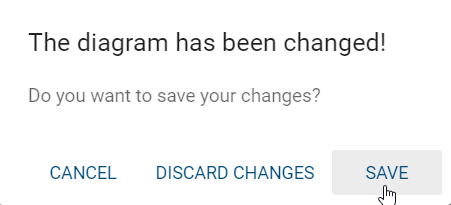
Note
While translating a diagram, accessing the editor or using other options are not possible.
Navigation
How can I zoom in the designer?
You can apply the zoom to the for modeling opened diagram or to the entire website. This depends on where you place your mouse while zooming. The selection can be made by placing the mouse outside (not color coded) or inside (color coded) the editor.
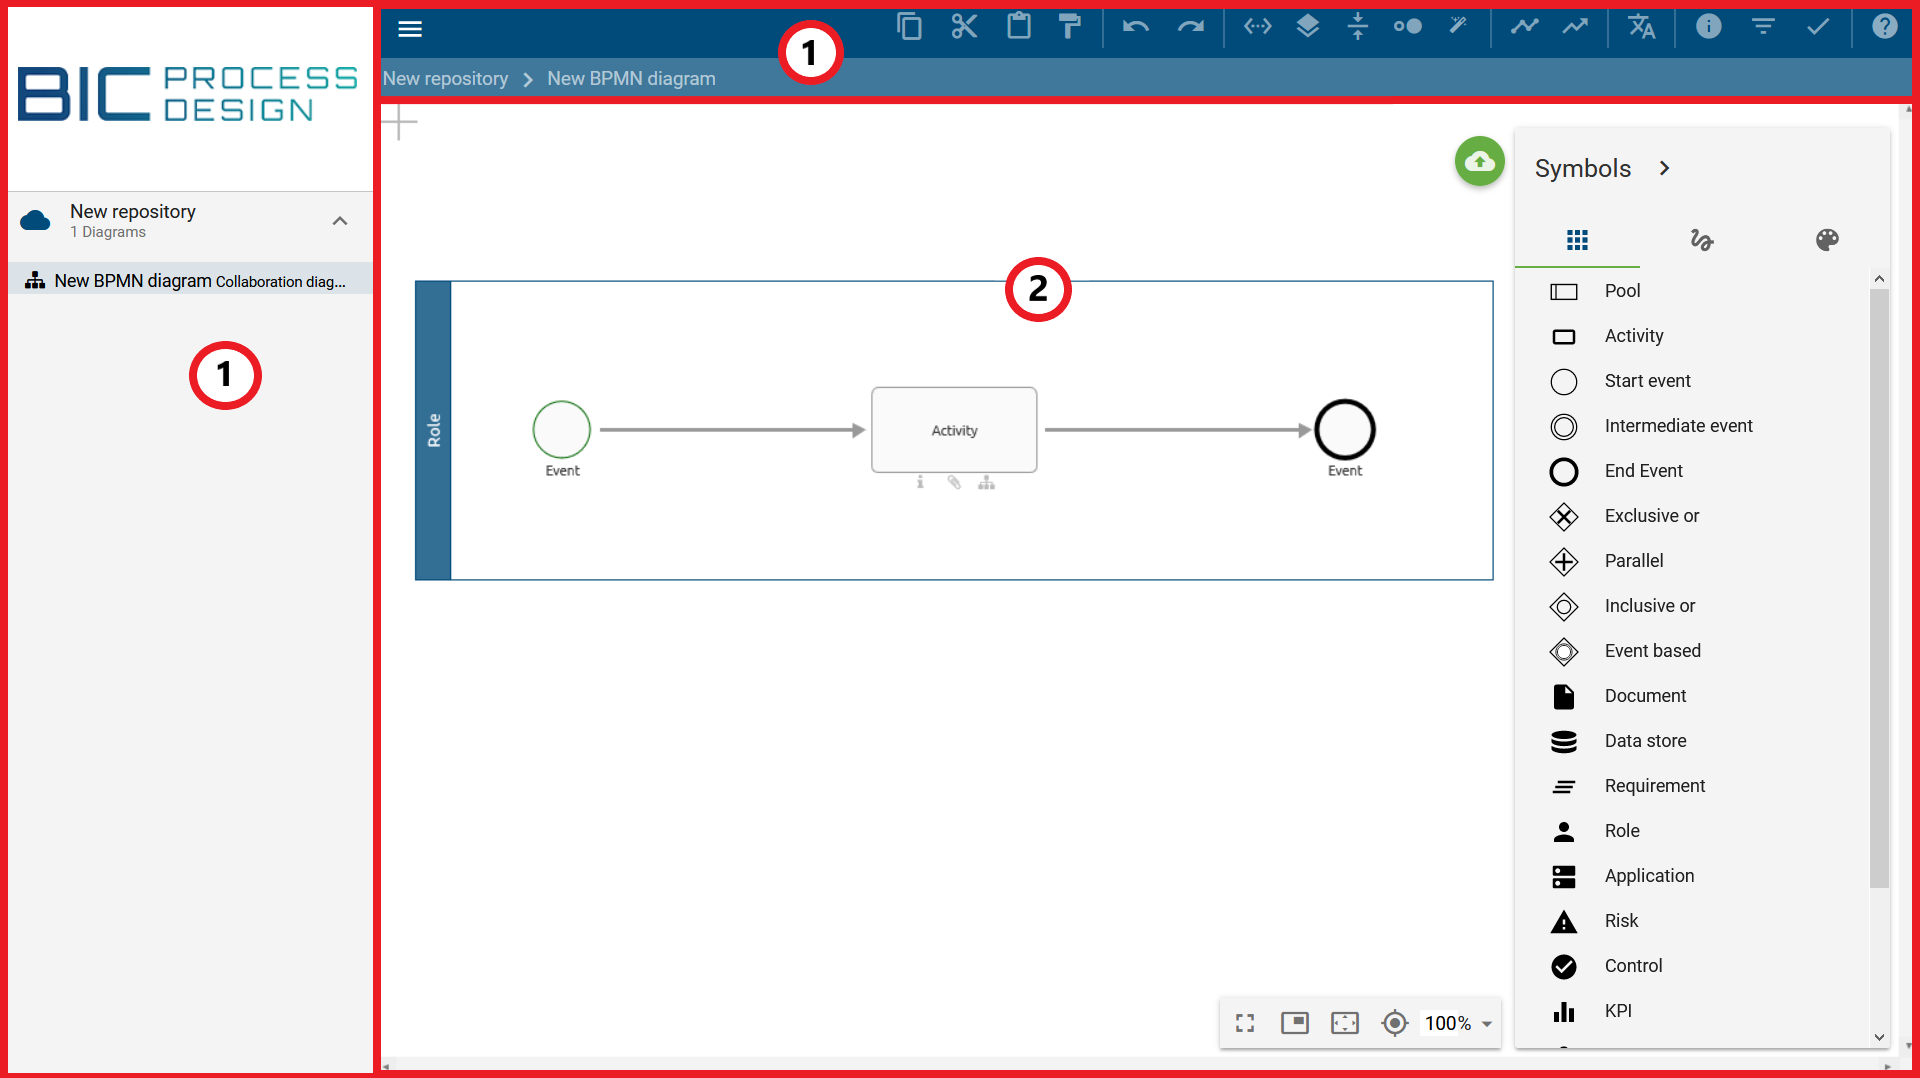
Now hold down the Ctrl key and scroll with the mouse wheel. Optionally, you can zoom the whole website by holding down the Ctrl key and pressing + to zoom in or - to zoom out.
How can I navigate the diagram while modeling?
In a checked-out diagram in edit mode, you can navigate by holding down the right mouse button or by scrolling and using the scrollbar.
Furthermore, there is a navigation bar at the right bottom of the editor, which offers the following possibilities:
Navigator: Click on the first entry to Toggle diagram navigator. It gives you an overview of the diagram and thus allows you to navigate easily by moving the transparent rectangle with the mouse. The size of the rectangle can be changed by dragging and dropping the edges, which corresponds to zooming in the diagram. Click again on the button to hide the navigator.
Fullscreen: If you click the second button, Toggle fullscreen, both the application and the browser will switch to full screen mode. A subsequent click on the button will exit fullscreen mode for both the application and the browser, returning you to the original view. Please note that the ESC key only exits the browser’s fullscreen mode. This can interfere with the ESC functionality for other application features, such as deactivating stamp mode.
Adjust content to window size: By clicking on the third button, the diagram will be zoomed and scrolled, so that you can see the whole diagram in the editor.
Scroll selection into view: A click on the fourth button scrolls the diagram to 0/0 position.
Zoom level: The fifth function allows you to set different zoom levels in percent. Preset levels appear when you click on the arrow. You can then select one of the zoom levels from the list. Furthermore, it is possible to set your own zoom level between 10% and 800%. To do this, click on the displayed number, enter a new percentage and confirm with the Enter key or click on the diagram.
How do I open a subprocess?
While modeling, you can jump directly from a diagram into a refined diagram which is maintained in the subprocess attribute.
If you have opened a diagram containing an activity with a subprocess diagram in the designer, you can click the highlighted diagram icon below the object. Alternatively, navigate to the attributes of the object and click on the diagram in Subprocess.
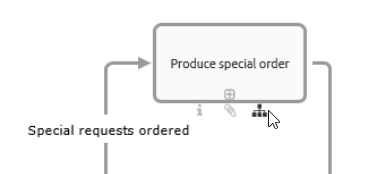
If you have also checked out the subprocess diagram, this diagram will be displayed in the designer. In case you have not checked out the diagram, the click opens the diagram in the public workspace of BIC Process Design. This happens in a new browser tab or if the application is running in another tab, you will be navigated to the diagram there.
In case there is more than one subprocess diagram available (i.e. one or more diagrams are maintained in the Variants attribute), an alphabetically sorted list of all subprocess diagrams is shown after selecting the diagram symbol. You can choose the diagram which you like to view.
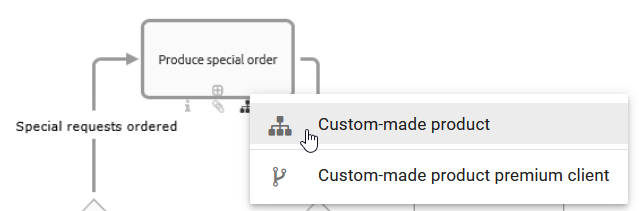
Note
Subprocesses also display diagrams to which you have no access. If you navigate into these diagrams, you will get a corresponding message and can not see the content of the diagram.
How do I open a subprocess when multiple ones are maintained?
BIC Process Design offers the possibility to maintain multiple variants within the attributes. You can open them in the same way as you can open one subprocess. However, a simple click on the diagram icon under the object will give you an alphabetically sorted list of all the subprocesses. This gives you the opportunity to see at a glance which navigation options are available to you. The top entry reflects the subprocess field, followed by the variants. Select the required subprocess to follow the link as described above.
Note
If you have no access to a subprocess, the corresponding list entry is greyed out and you will not be able to select it.
Useful hints
In this section, you find some concluding tips that facilitate the modeling in BIC Process Design.
Which is the best position for the diagram?
Align your diagrams at the 0/0 position to ensure that they will be displayed optimally after checking-in.
How can I practice modeling?
To learn new methods and practice modeling, create a repository named Playground. This helps you avoid inconsistent catalog items in your existing content.
How can I make a multi selection?
Select several elements at the same time, either by dragging with pressed mouse key over the area in which these elements are located or by holding the CTRL key and clicking on the corresponding symbols. Also note the possible shortcuts.
How can I deselect objects in a diagram?
If you have selected too many elements at the same time, you can remove individual objects from the selection by deselecting them. To do this, hold down the Shift key and click on the wrongly selected object.
How can I see the description of an object?
If you have maintained a description of an object, the corresponding attribute symbol “i” is highlighted on the object. Hold the mouse over this symbol. A tooltip with the description appears as a preview. Alternatively, you can also see the description of the object by clicking on the attribute symbol or by opening the attributes tab.
How can I deposit websites in the attachments?
In the attribute-tab, you can deposit websites in the attachments by typing in the URL and confirming with the “Return”-key.
How can I see the description of an object?
If you have maintained a description of an object, the corresponding attribute symbol “i” is highlighted on the object. Hold the mouse over this symbol. A tooltip with the description appears as a preview. Alternatively, you can also see the description of the object by clicking on the attribute symbol or by opening the attributes tab.
Should I always use the same browser for modeling?
After checking-out, your diagrams will be saved locally in the local storage of your browser. Therefore, you should always use the same browser.
What should I look for after modeling?
Save your diagrams regularly and check them in. This will help you avoid data loss and ensure that other users can access the diagrams. If a diagram is not checked in, it remains locked for other users.