Diagrams
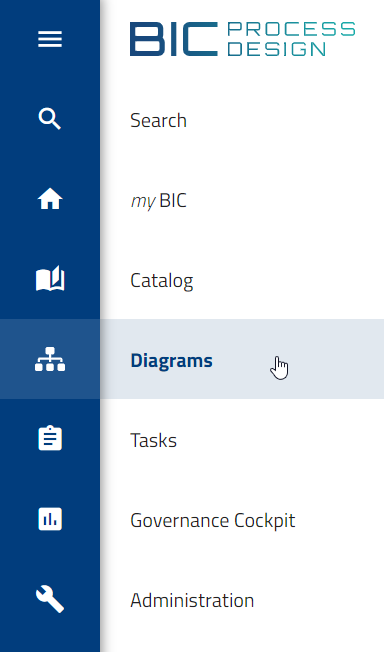
The Diagrams menu item in the left menu bar takes you to the diagram area. There you can view and manage all diagrams in the current repository.
In this chapter, you will learn how to find, create, and organize diagrams. It also explains how to structure diagrams using categories, use different views such as List, Gallery, and Dashboard, and search, filter, and export diagrams.
Where can I find diagrams and categories?
Use the menu item Diagrams in the left menu bar to see all diagrams of the current repository. The diagrams can be organized in categories.
In the Diagrams section you can switch between the views List, Gallery and Dashboard. The List view is opened by default. In the main area you see all diagrams that belong directly to the current repository.
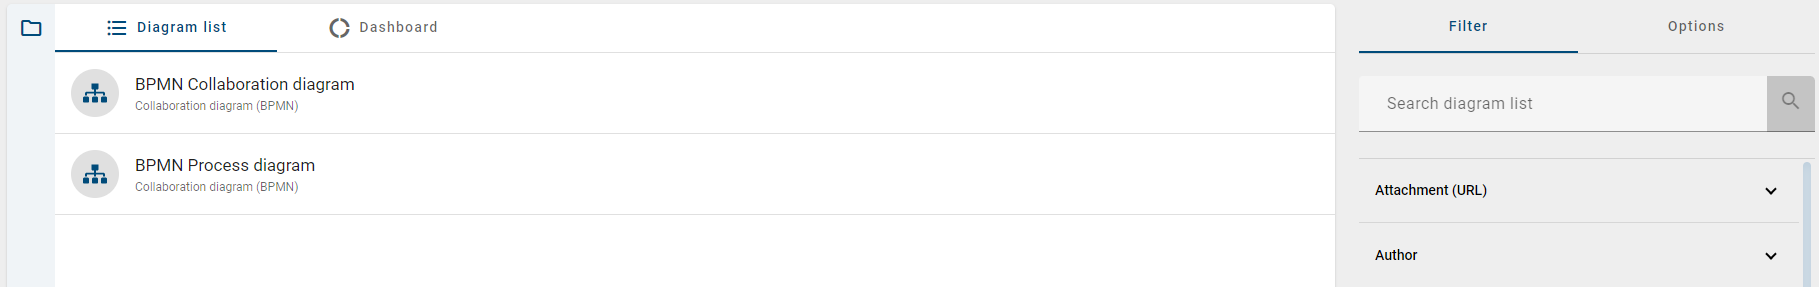
When you open the List tab, the diagrams are sorted alphabetically by their name. The diagram name is shown in the current content language. The diagram type is shown in the language of the user interface. Click on a diagram entry to open the diagram view. From there you can also open alternative views.
Hint
If you are in the public workspace and open an empty category, a default page is displayed. It explains that there are no diagrams in this category yet. You can open a subcategory, use the diagram search, or click the plus symbol to create a new diagram.
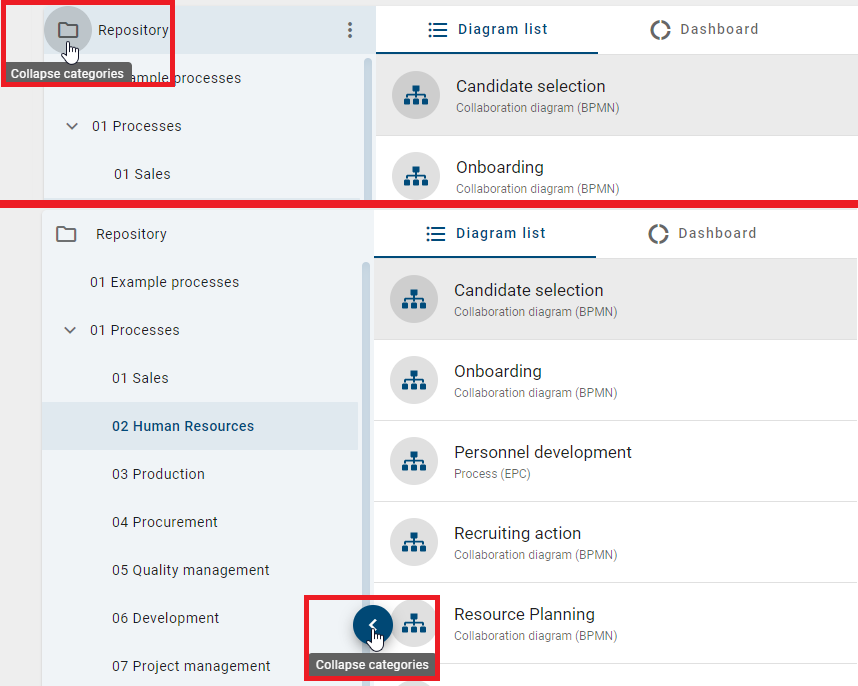
In the vertical bar on the left side of the main area you can find the categories. Click Open categories to open the explorer panel. You can click the folder icon or the vertical bar.
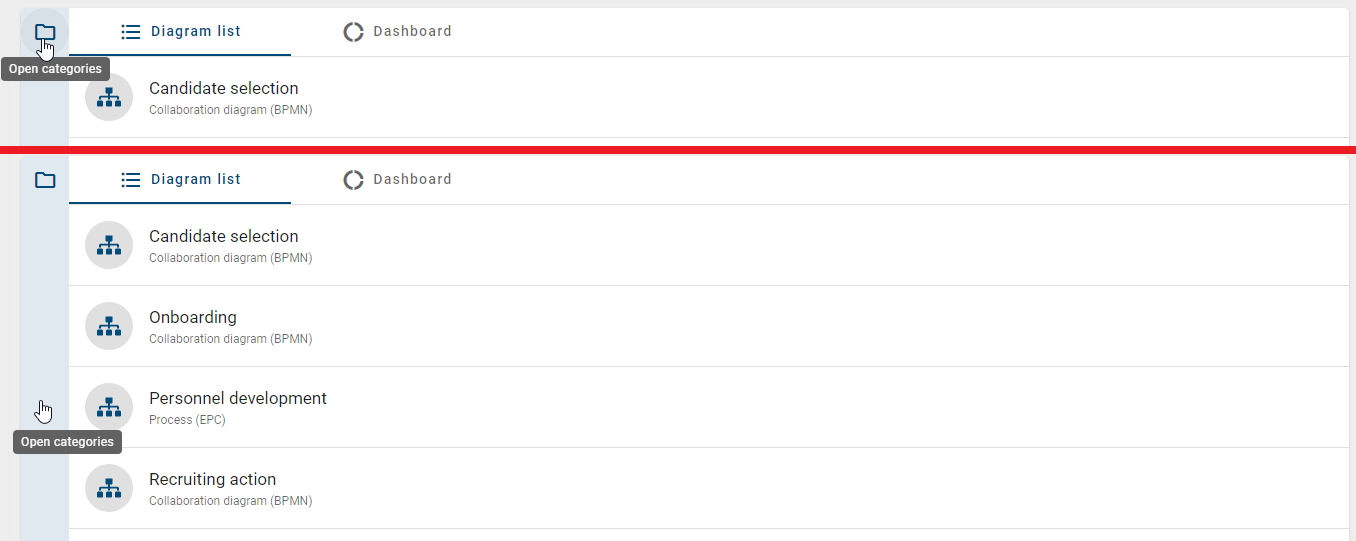
Then you see the categories that belong directly to the repository. The names are shown in the current content language. When you select a category, it opens. The diagrams in this category appear in the main area.
Tip
You can enlarge the main area by toggling the menu bar in the left sidebar.
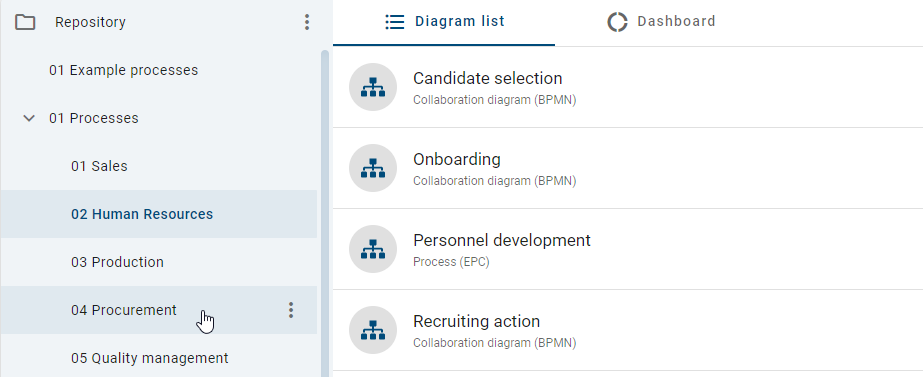
Categories can also contain subcategories. This is shown by an arrow next to the category name. You can open a subcategory by clicking the name or the arrow. You can close the category panel with the button Collapse categories. You can also navigate using the breadcrumb navigation in the header bar.
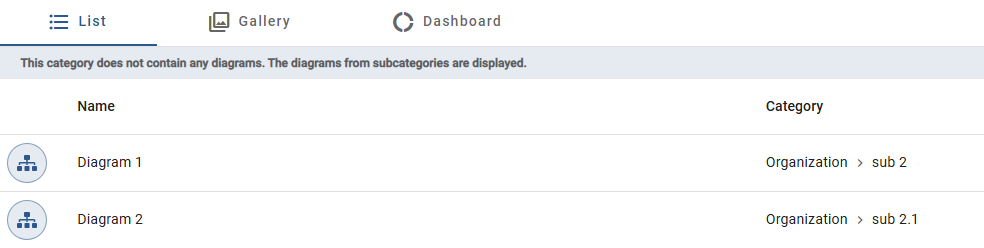
If a category does not contain its own diagrams but has subcategories with diagrams, all diagrams from the subcategories are shown when the category is opened. The diagrams are grouped by their parent category and sorted alphabetically inside each group. In addition, the note This category does not contain any diagrams. The diagrams from the subcategories are displayed. is shown.
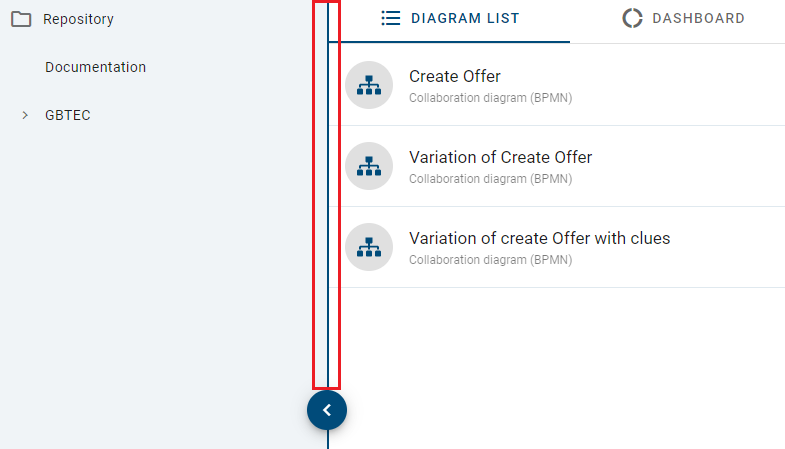
You can also change the size of the category panel. Move the mouse to the right border of the category panel. A blue line appears. Hold the mouse button and drag the line to the left to make the panel smaller or to the right to make it larger.
On the right side of the screen, the desktop view shows the options and the filters. The options currently include different export functions. These functions create Excel files with the content and additional information for all diagrams in the category. More information can be found in the Exports chapter.
Tip
In many views, for example in Search, Diagrams, Catalog, or Governance Cockpit, you will see a right sidebar. You can adjust its width by moving the mouse to the left edge until the cursor changes, then holding the left mouse button and dragging the edge left or right. You can also close the sidebar using the Collapse button next to the tabs at the top and open it again using the Expand button. When reopened, the sidebar automatically restores the previously set width.
Create diagrams
How can I create a diagram?
If you open the Diagrams menu item in the left menu bar, all diagrams that are stored in the current repository as a directly parent category are listed in the main area. If you have previously selected a subcategory, it will be saved and you will navigate to that category again the next time you open it. If you open the Diagrams menu item as an Administrator, Editor or Author, you also have the option of creating a new diagram.
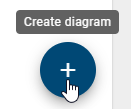
You can create a new diagram by clicking on the button at the bottom right corner of the diagram list.
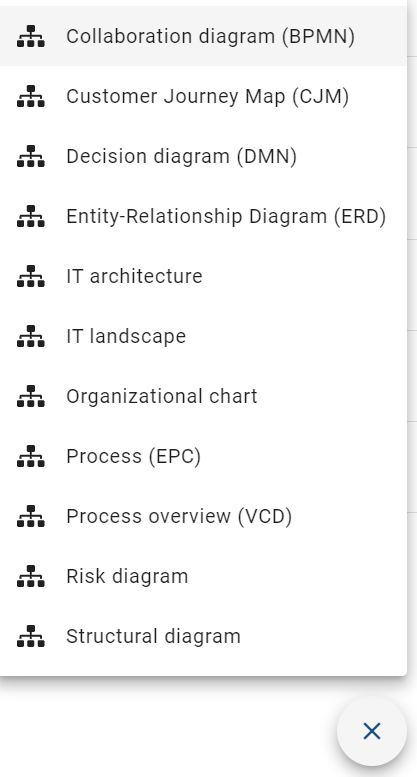
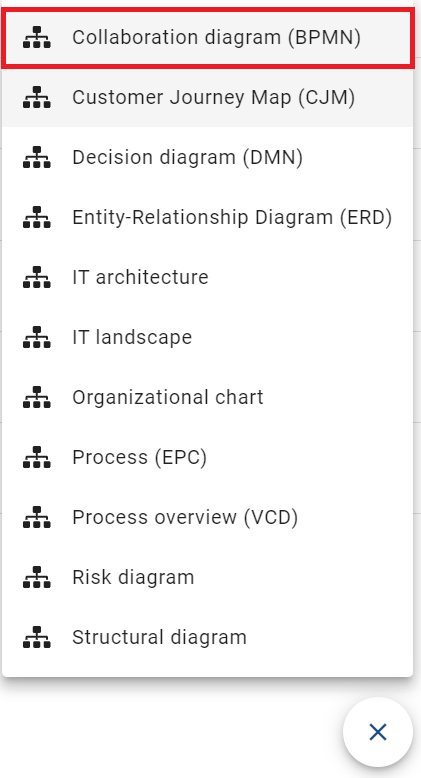
Once you have clicked on Create diagram, a list of all supported diagram types will be displayed, from which you can select the desired diagram type. Should you wish to cancel the process prematurely, you can do so by clicking on the X button.
Once you have selected the desired diagram type, you will then have the option to name the diagram.
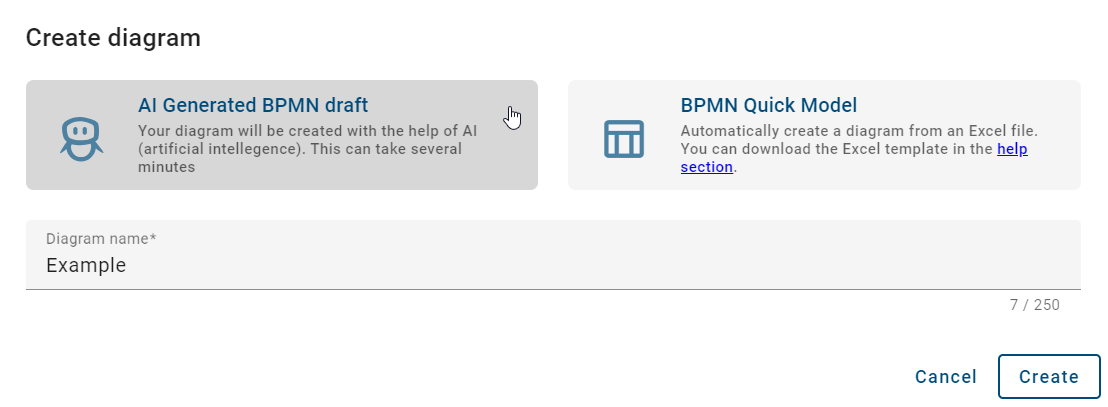
Then click on the Create button to display your new diagram.
Quick Modeler
The Quick Modeler is an Excel file containing a table necessary for quick modeling. Within the Excel file, you will find a detailed introduction to the Quick Modeler, along with a template featuring an example.
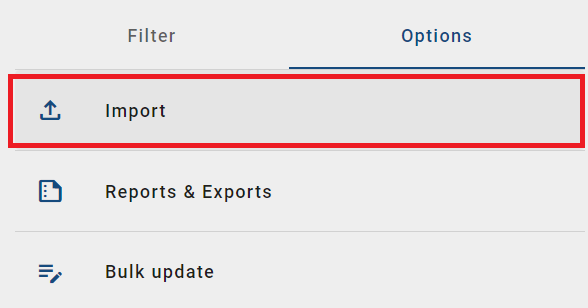
To use the Quick Modeler, navigate to Options in the right sidebar and select Import.
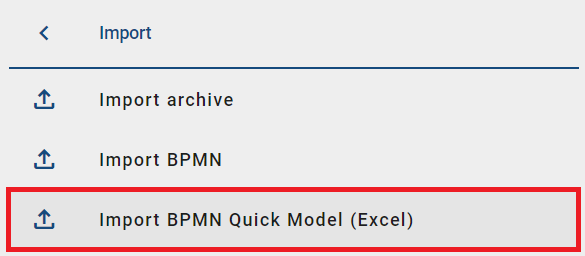
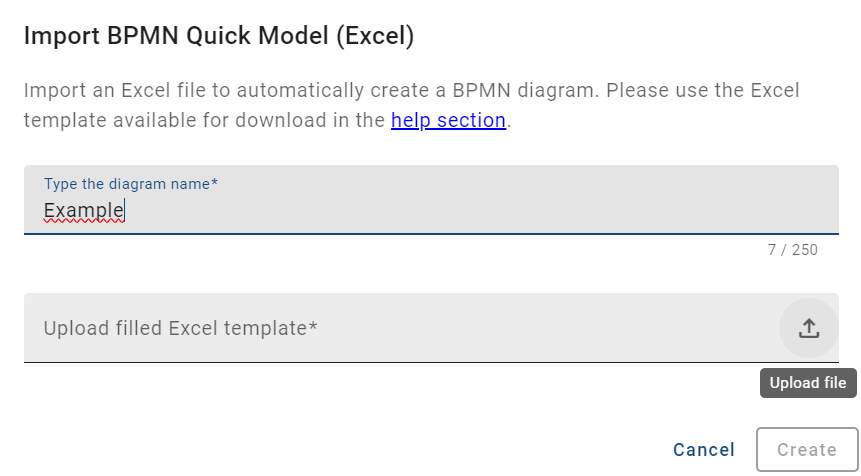
Then click on the Import BPMN Quick Model (Excel) option.
A dialog will then open, in which you must provide a name for the diagram and upload the previously completed Quick Modeler Template (Excel).
Now you can create the diagram through the Quick Modeler.
Hint
Please be aware that the Excel file is currently available only in English.
Note
Please note that only users with the roles Administrator and Editor can import an Excel file. Authors who normally do not have access to the created diagram are excluded from this import function.
AI-generated diagrams
How can I create an AI-generated BPMN process?
If you open the Diagrams menu item in the left menu bar, all diagrams that are stored in the current repository as a directly parent category are listed in the main area. If you open the Diagrams menu item as an Administrator, Editor or Author, you also have the option of creating an AI-generated BPMN process.
To create an AI-generated BPMN process, you need to create a new diagram. To do this, click on the Create diagram button at the bottom right. A list of all supported diagram types will then open. Select the Collaboration diagram (BPMN) diagram type. If you do not wish to proceed, you can cancel the dialog at any time by clicking the X button.
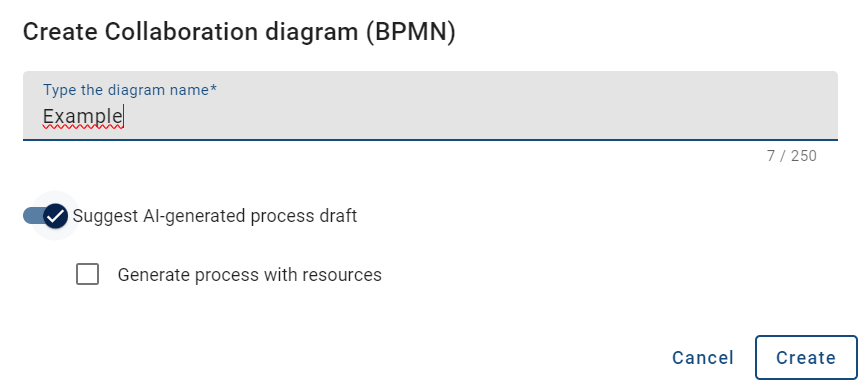
After selecting the Collaboration Diagram (BPMN), a dialog will open. First, assign a name to the diagram. If you want to create an AI-generated BPMN process, activate the Generate process with AI option, which is deactivated by default.
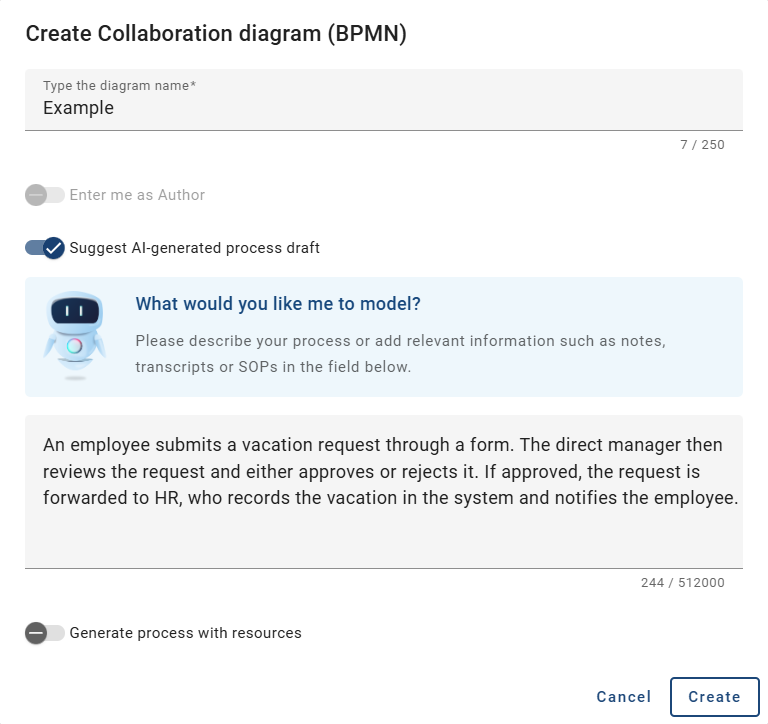
Activating this option allows you to describe the process so that Arty can create a corresponding diagram based on your information. You can enter your description directly into the text field or drag and drop a text document into it.
If your input is a transcribed conversation, you can activate the Input is a transcribed conversation checkbox. The checkbox is unchecked by default. If you activate it, Arty treats the entered or uploaded content as a transcript when generating the diagram. The checkbox and the Generate a simplified process flow option cannot be active at the same time.
Click the Create button at the bottom of the dialog to generate the diagram in your current content language. Then, an illustration of Arty will be displayed while the diagram is being created. This process may take a few minutes. You will then either be automatically redirected to the diagram view, or you will receive an error message.
Note
Please note that when dragging a text document into the text field using drag and drop, only the text contained in the document is transferred. Structural elements such as headings or images are not taken into account.
Hint
This function is performed by Arty, our AI Modeler. Please note, that this function requires a separate license. Please also refer to the notes on using the AI feature.
How can I create an AI-generated Business Capabability Map?
If you open the Diagrams menu item in the left navigation as an Administrator, Editor, or Author, you also have the option to generate a diagram of the type Business Capability Map using AI. To do so, you must create a new diagram. After selecting the diagram type Business Capability Map, a dialog opens in which you must first enter a name for the diagram. To create an AI-generated Business Capability Map, additionally activate the option Generate overview with AI, which is disabled by default.
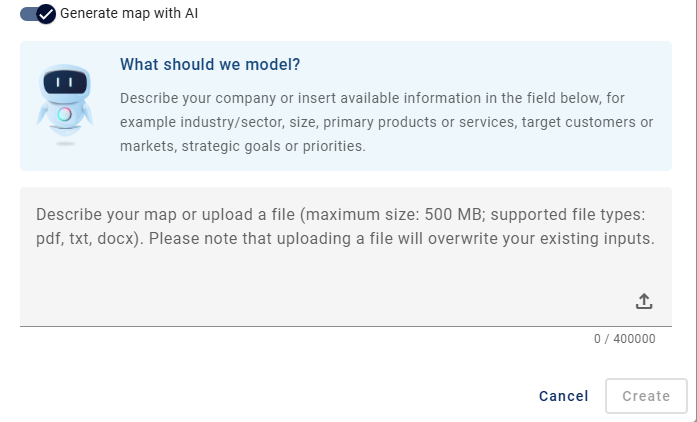
By activating this option, you can describe the desired overview so that Arty can create a corresponding diagram based on your input. You can enter your description directly into the text field or drag and drop a text document into it.
Then click the Create button to generate the diagram in your current content language. While the diagram is being created, an image from Arty will be displayed. This process may take several minutes. Afterward, you will either be automatically redirected to the Business Capability Map or receive an error message. To cancel the creation, click the Cancel button.
Note
Please note that when you drag and drop a text document into the text field, only the text it contains will be imported. Structural elements such as headings or images will not be taken into account.
Hint
This feature is provided by Arty, our AI modeler. Please note that a separate license is required. Also be sure to observe the guidelines for using the AI functionality.
Hint
Please note that BIC EAM is not included in the standard licence. Please contact your representative for more information.
How can I define the level of detail for an AI-generated BPMN process?
As a user with the Administrator, Editor or Author role, you have the option to define the level of detail for an AI-generated BPMN process. To do so, go to the Diagrams menu item in the left menu bar and click the Create diagram button at the bottom right. A list of all supported diagram types will then open. Select the Collaboration diagram (BPMN) diagram type.
After selecting the Collaboration diagram (BPMN) diagram type, a dialog opens where you must first assign a name to the diagram. To define the level of detail, you must enable the Generate process with AI option, which is disabled by default.
Once activated, the additional section How should the process be generated? is displayed. There you can define whether the AI-generated BPMN process should be created as a simplified process flow.
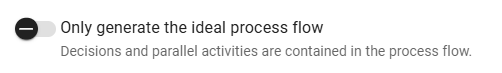
Generate a simplified process flow disabled:
If the option is disabled, the generated process flow can contain all possible paths, decisions, and branches.
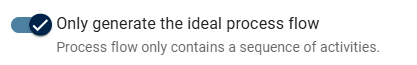
Generate a simplified process flow enabled:
Activate the option if the process should be generated as a simplified flow. In this case, the process flow only contains a sequence of activities and omits alternative paths.
After choosing the desired level of detail, click the Create button to generate the diagram in your current content language. An illustration of Arty will then appear while the diagram is being created. This process may take a few minutes. Afterwards, you will either be automatically redirected to the diagram view or receive an error message.
Afterwards, Arty generates the diagram based on the current content language and displays it accordingly.
Hint
This function is performed by Arty, our AI Modeler. Please note, that this function requires a separate license. Please also refer to the notes on using the AI feature.
How can I request additional resources for an AI-generated diagram?
If you open the Diagrams menu item in the left menu bar, all diagrams that are stored in the current repository as a directly superordinate category are listed in the main area. If you open the Diagrams menu item as Administrator or Editor, you also have the option of creating an AI-generated BPMN process. When creating an AI-generated BPMN process, you can optionally request additional resources (documents, applications, risks).
After you have selected the diagram type Collaboration diagram (BPMN), a dialog opens in which you must first assign a name for the diagram. To specify the level of detail, you must first activate the option Generate process with AI, which is deactivated by default.
In this dialog, you can also include additional resources such as documents, applications or risks. To do this, activate the Generate process with resources switch. This option is deactivated by default.
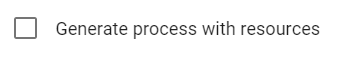
Additional resources can only be included in the modeling if the Generate process with resources option is activated.
Hint
This function is performed by Arty, our AI Modeler. Please note, that this function requires a separate license. Please also refer to the notes on using the AI feature.
How can I be directly assigned as an Author in a diagram?
If you open the Diagrams menu item in the left menu bar, all diagrams that are stored in the current repository as a directly parent category are listed in the main area. If you have previously selected a subcategory, it will be saved and you will navigate to that category again the next time you open it. If you open the Diagrams menu item as an Administrator, Editor, or Author, you also have the option of creating a diagram and directly assigning yourself to the Author governance attribute during the creation process.
To assign yourself directly to the Author governance attribute during the creation process, you must create a new diagram. To do this, click the Create diagram button at the bottom right. A list of all supported diagram types will appear from which you can select the desired type. Once you have selected a diagram type, a dialog will appear.
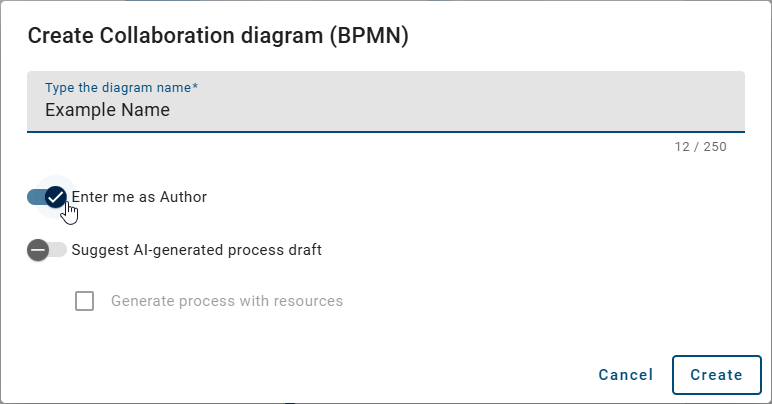
In this dialog, you can give the diagram a name and assign yourself to the Author governance attribute. The Enter me as Author option is activated by default. If you do not deactivate this option, you will automatically be entered in the Author governance attribute of the created diagram and, if not available, a catalog object of type “Person” will be created of you. If you do not want this, you can deactivate the option and create the diagram without assigning an author. Finally, click the Create button to complete the process.
Hint
Please note that the Generate process with AI option shown in the screenshot can only be displayed and activated if the corresponding feature is available. This function is performed by Arty, our AI Modeler. Please note, that this function requires a separate license. Please also refer to the notes on using the AI feature.
How can I create a copy of a diagram?
When you open the Diagrams menu item in the left menu bar, all diagrams stored in the current repository are listed in the main area. As an Administrator, Editor, or Author, you can copy diagrams in the public workspace to use them as a starting point for new diagrams. The original diagram remains unchanged.
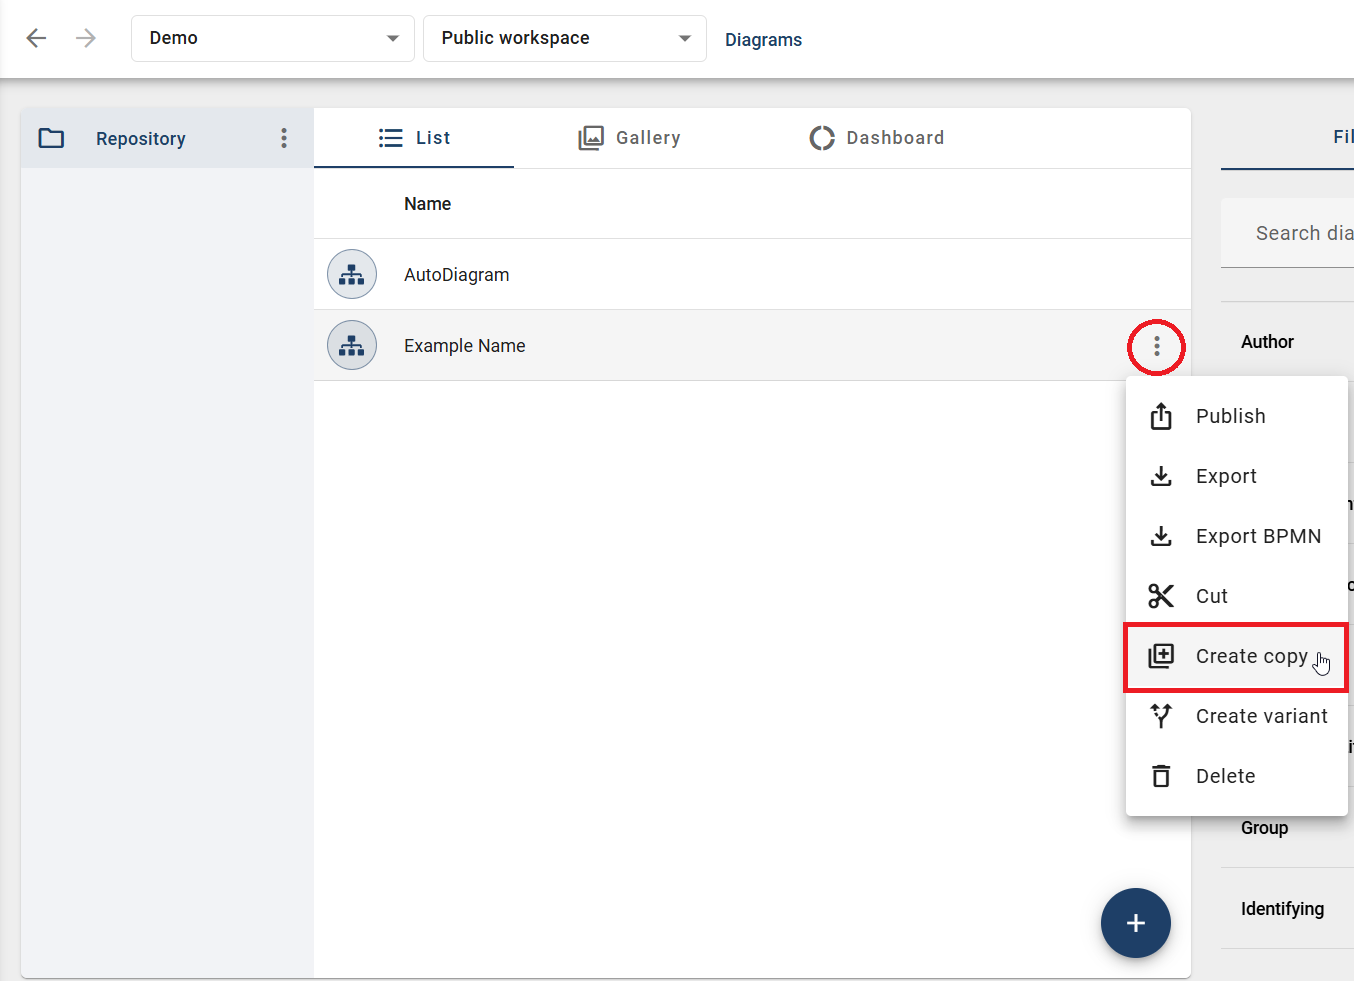
By default, the List tab is shown. All diagrams in the currently selected content language are displayed in the main area. You can select the Copy button from the context menu with the three dots of a diagram.
After clicking the Create copy button, a dialog opens. In this dialog, you can enter the name of the new diagram. If a name already exists for the original diagram in the current content language, it is automatically suggested. You can also choose whether you want to be listed as the Author in the copied diagram.
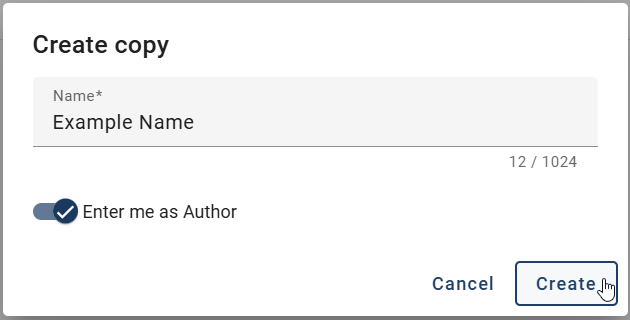
You can save the copy by clicking the Create button in the dialog. After the copy is completed successfully, the new diagram appears in the same category as the original diagram and is shown at the top of the diagram list. If you cancel the process by clicking the Cancel button, the dialog closes and you return to the diagram list. In this case, no copy is created and your entries are not saved.
Hint
Please note that when copying a diagram, the current version in the public workspace is used as the basis. It is not possible to create a copy of a locally edited diagram that has not yet been checked in, because only the version available on the server is used.
Note
Please note that you can only create a copy if at least one character has been entered in the name field.
How can I delete a diagram?
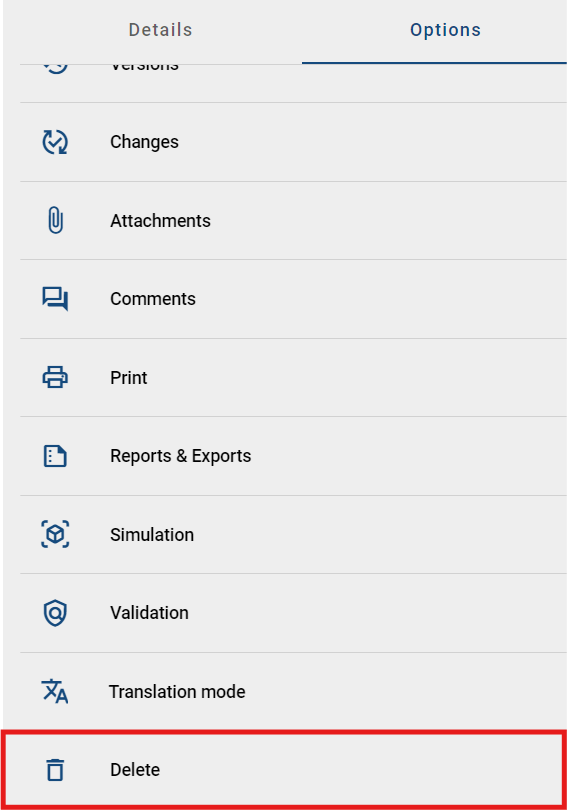
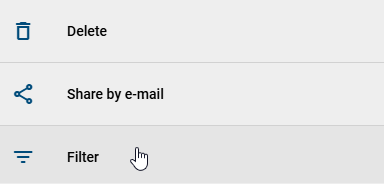
As an Administrator, Editor, and Author you have the ability to delete diagrams in the public workspace as needed. To do so, click on the Delete option in the respective context menu (three dots) of the diagram. Alternatively, you can find the option in the Options of the respective diagram after selecting it.
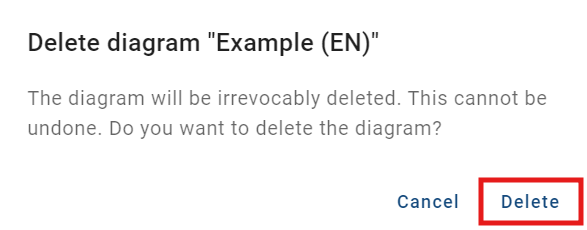
After you click on Delete, a dialog will appear informing you that the diagram will be irrevocably deleted. This action cannot be undone. You can confirm the deletion process by clicking the Delete button again. To cancel the process, click on Cancel.
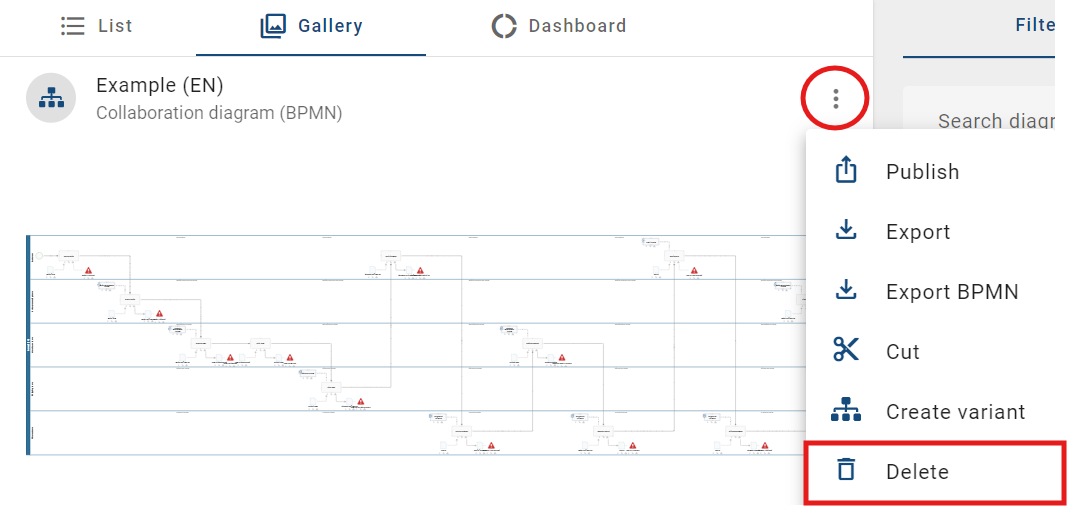
You can also delete the diagram directly in the Gallery. To do this, click on the context menu (three dots) of the diagram and select the Delete option. Then, follow the same steps as mentioned above.
Hint
Please note that locked diagrams cannot be deleted.
How can I rename a diagram?
If you open the Diagrams menu item in the left menu bar, all diagrams that are stored in the current repository as a directly parent category are listed in the main area. As an Administrator, Editor, or Author, you have the option to rename diagrams in the public workspace as needed without checking them out.
The List tab is displayed by default. All diagrams with the current repository as a directly superordinate category are listed in the main area. For each diagram, you can see the name and the associated diagram type in the browser language set for the current content language.
To rename a diagram, hover the mouse pointer over an existing diagram in the list view. A pencil symbol will then appear that you can click to edit the name.
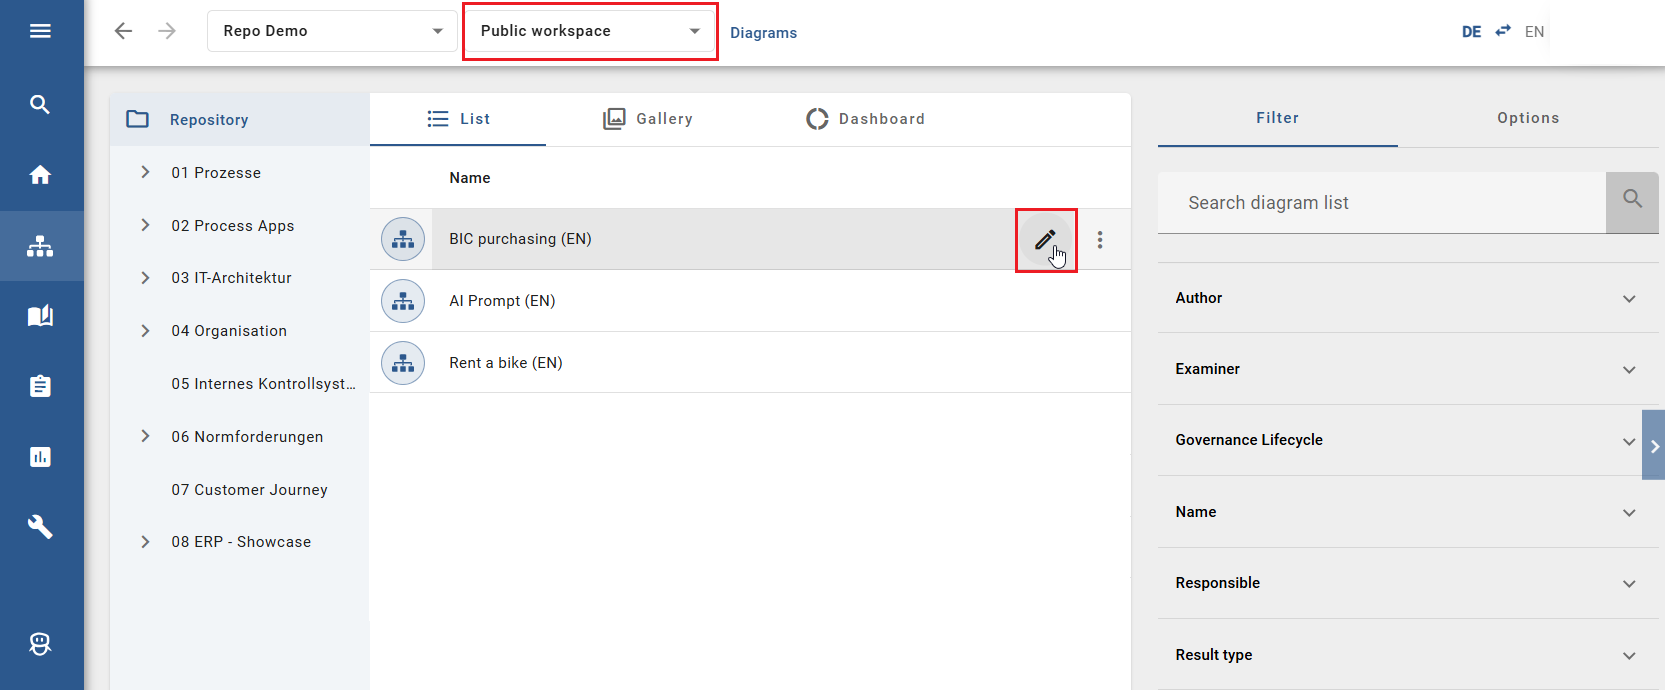
To save the new name, click the checkmark symbol. To cancel the process, click the X symbol. Alternatively, you can cancel by clicking on any free space outside the input field.
Note
Please note that you cannot rename a locked diagram. In this case, the name field will remain in read-only mode.
Functions in category explorer
To select a function for a diagram category, you need to be assigned as an Administrator, Editor or Author role and be in Public Workspace. Here you can find how to change the stage. Below you will find an overview of the functions and the permissions of the roles.
Author |
Editor |
Administrator |
|
|---|---|---|---|
Create new category |
Authorized |
Authorized |
Authorized |
Publish |
Not authorized |
Authorized |
Authorized |
Export |
Not authorized |
Not authorized |
Authorized |
Import |
Not authorized |
Not authorized |
Authorized |
Delete |
Authorized(*) |
Authorized(*) |
Authorized(*) |
Rename |
Authorized(*) |
Authorized(*) |
Authorized(*) |
Cut |
Authorized(*) |
Authorized(*) |
Authorized(*) |
Paste |
Authorized |
Authorized |
Authorized |
(*)The function can only be executed in the context menu for diagram categories and not for the repository.
How can I create diagram categories?
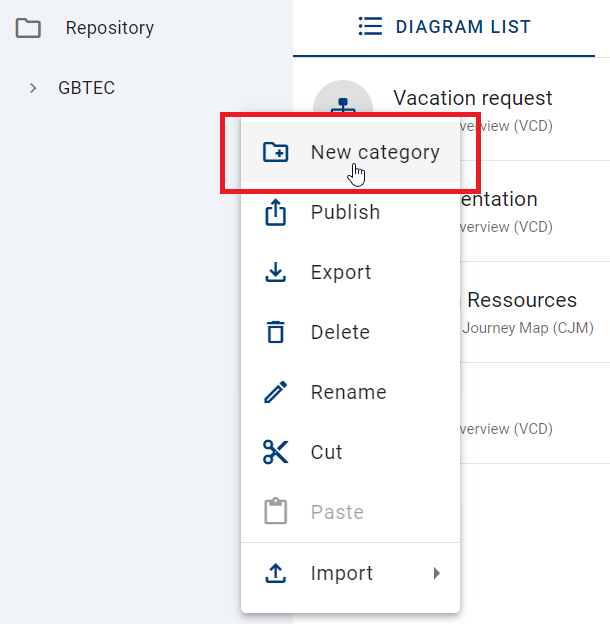
You can create diagram categories in the category explorer. Open the explorer menu and click on the context menu (three dots) next to your repository folder. Select the option New category.
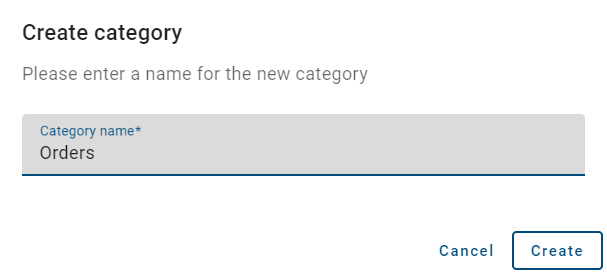
Enter the category name and confirm with Create. The diagram category will be shown in the category explorer alphabetically sorted.
Hint
You can also create subcategories for already existing main categories. Therefore you can click on the context menu next to the category name and repeat the process. The created categories will be listed as subcategories for the selected main categories.
How can I rename diagram categories?
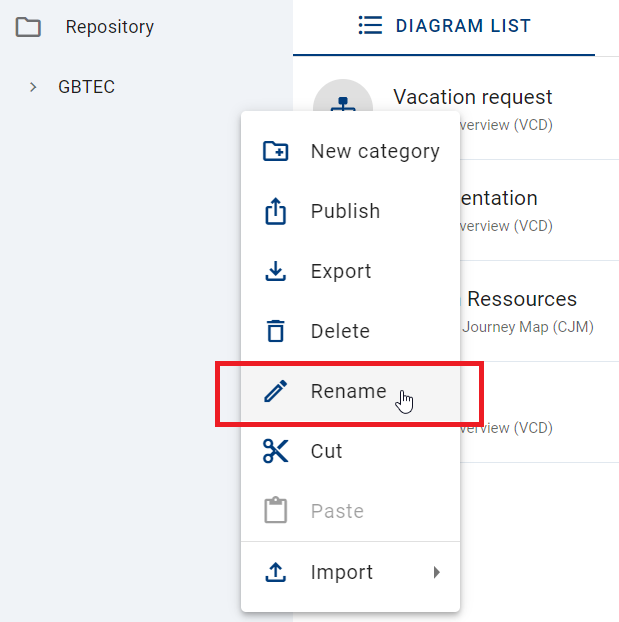
If you want to rename a diagram category name, you need to click on the context menu (three dots) and select Rename.
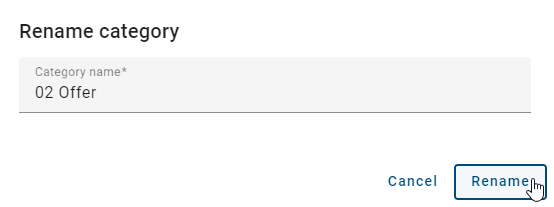
In the upcoming displayed dialog, you can enter a new name for the selected category. Type the new name into the input field and select Rename. To discard the renaming, click the Cancel button.
After the renaming is completed, the updated diagram category name is visible in the category explorer. Concurrent user need to refresh the view to see the made changes.
Note
You need to enter at least one character to complete the renaming.
Note
The renamed diagram category will only be displayed in your content language.
How can I delete diagram categories?
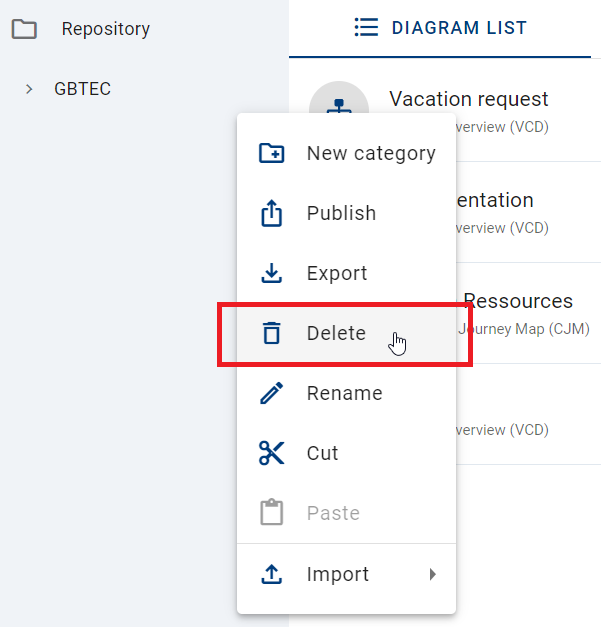
You can delete main and subcategories according to your needs. Click on the context menu (three dots) next to the category name and select Delete.
Then a dialog appears. If you do not want to delete the category, you can close the window by clicking on the Cancel button.
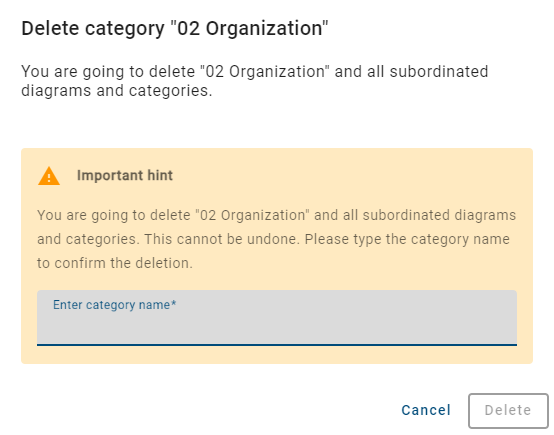
Hint
Please note that the input is case insensitive.
Enter the category name und click on Delete to complete your deletion.
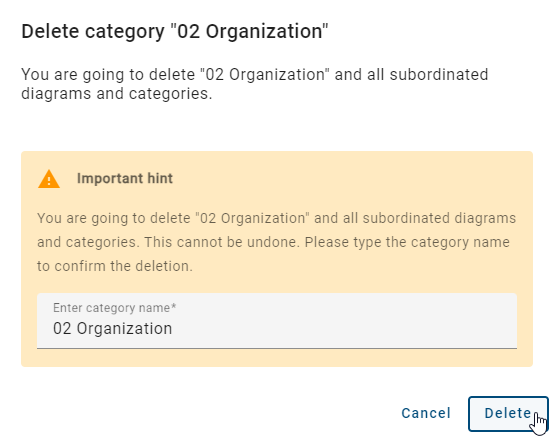
Hint
If the category contains subordinated diagrams and categories, they will be deleted as well. This cannot be undone.
How can I cut and paste diagrams and diagram categories?
Users with the Administrator, Editor, or Author user role can cut diagrams and diagram categories and paste them in another location in the same repository.
Cut and paste diagrams
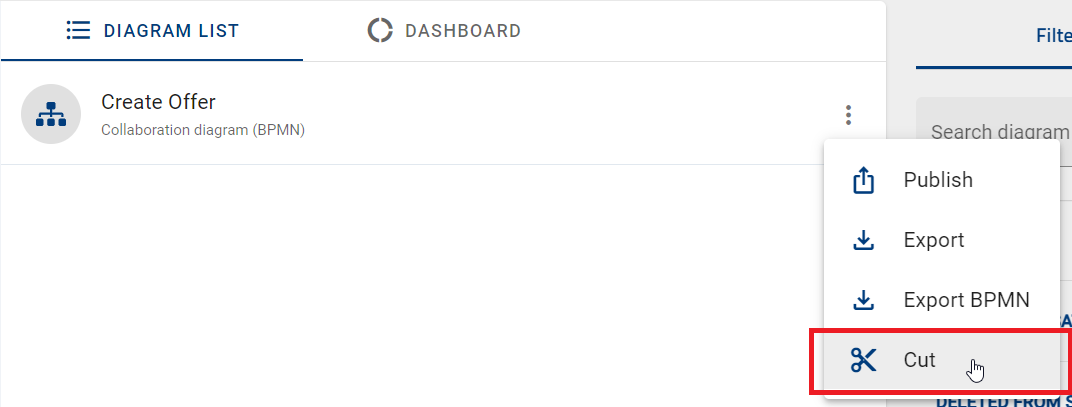
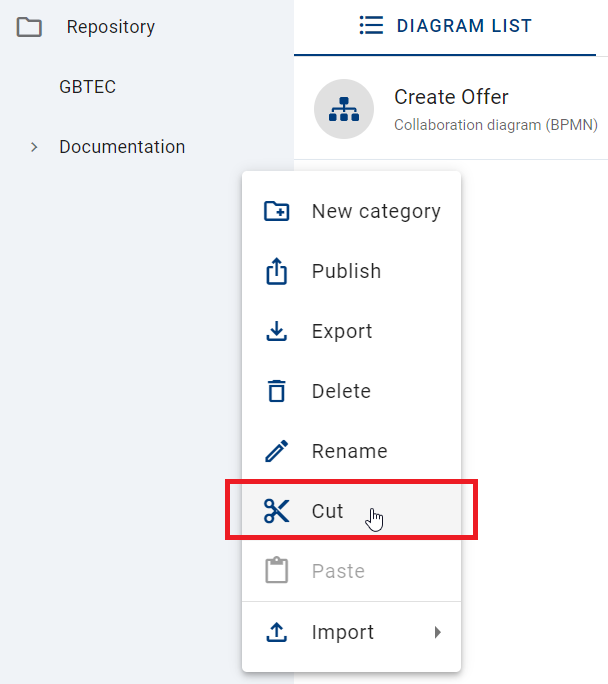
To move a diagram from one category to another, first open the Diagrams menu item in the left menu bar. Open the category that contains the desired diagram. In the diagram list, click the context menu of the diagram and select the Cut option.
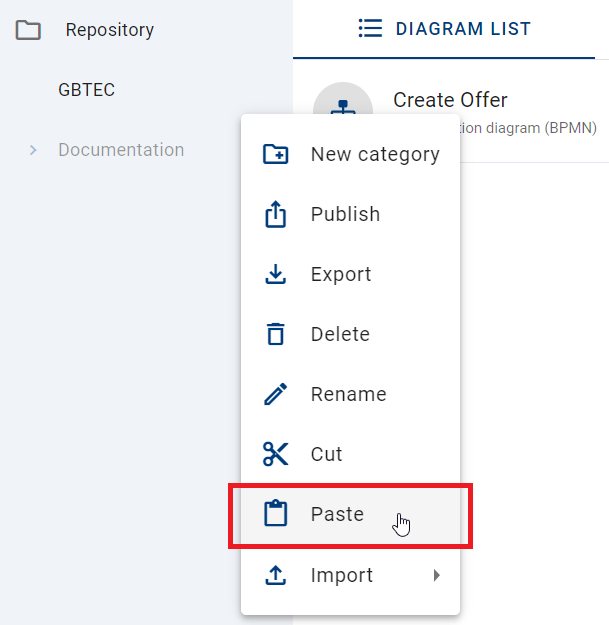
Then navigate to the target category. This can be a parent or a subcategory. Open the context menu there and select the Paste option.
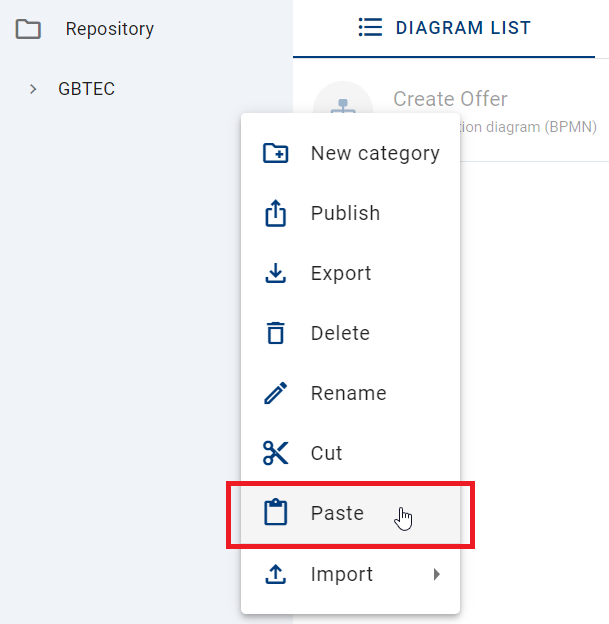
The diagram is removed from the original category and inserted into the selected category.
Cut and paste diagram categories
To move a diagram category, open the Diagrams menu item in the left menu bar. Open context menu next to the category name and select the option Cut.
All contained subcategories and diagrams are included in this action. Then go to the target category, open the context menu, and select the option Paste.
The cut action is cancelled if you
cut out a new diagram,
press the ESC key,
refresh the page or
change the repository.
Note
Diagrams and diagram categories can only be cut and pasted within the same repository. When you switch the repository, the clipboard is cleared.
Note
Diagrams cannot be cut or pasted if they are locked. Diagram categories cannot be cut or pasted if at least one contained diagram is locked. In these cases, the action fails and a notification is displayed in the lower right corner of the screen.
How can I publish diagram categories?
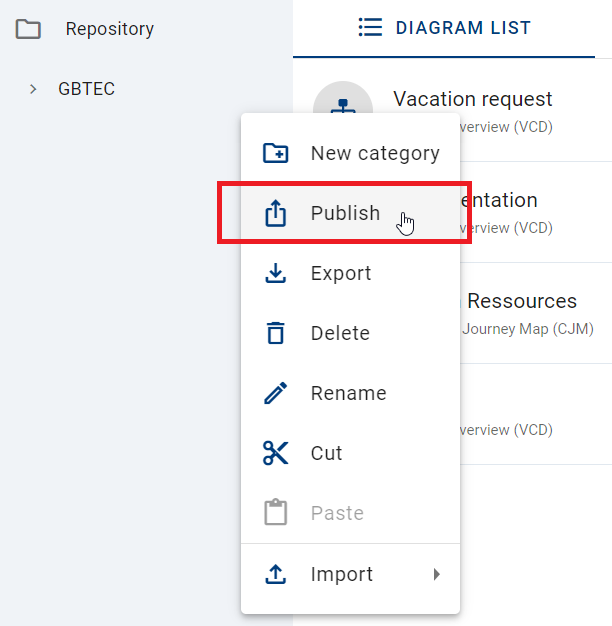
To publish your diagram category, click on the context menu (three dots) next to name and select Publish.
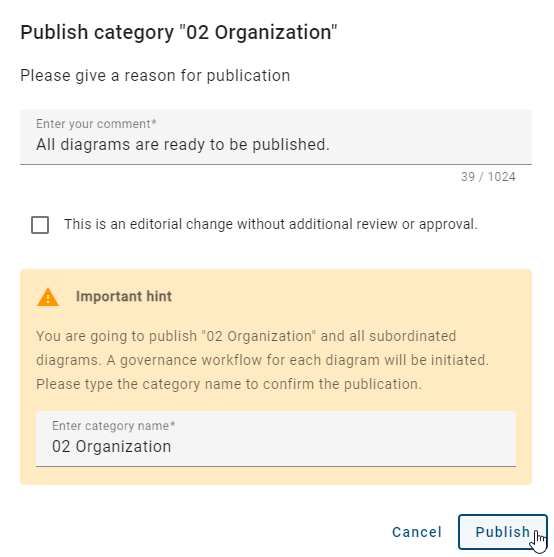
In the upcoming dialog you have to enter the category name and the reason for the publication and click Publish. If you want to discard the publication, select Cancel.
Hint
Please note that the input is case insensitive.
Hint
When you want to publish a diagram category, you are going to publish all subordinated diagrams as well. For each diagram a workflow will be initiated.
Note
You can also publish your repository. Select the context menu next to the repository and follow the same steps.
How can I export diagram categories?
Export in context menu (three dots)
You can export diagram categories by clicking on the context menu and selecting Export.
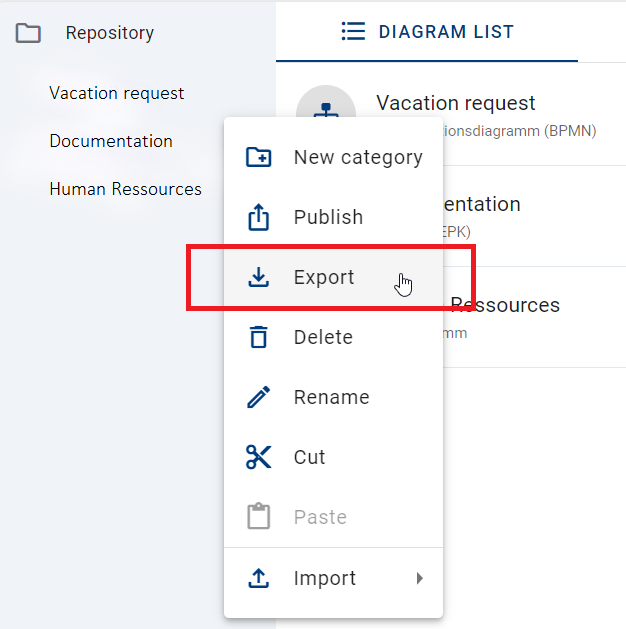
An archive of the diagram category will be created. The notification, which appears at the bottom right side of the screen, informs you about the start of the export.
Export in Options panel
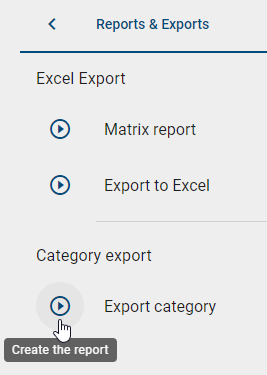
You can also export a diagram category in the Options panel. Click on Reports & Exports and select the Create the report button next to Export Category. The notification at the bottom right side of the screen informs you about the start of the export.
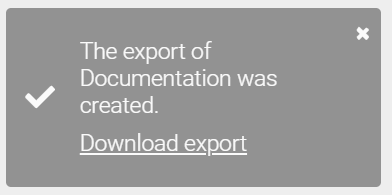
When the export is successfully completed, you will receive another message. This notification contains a link, that enables you to download the export.
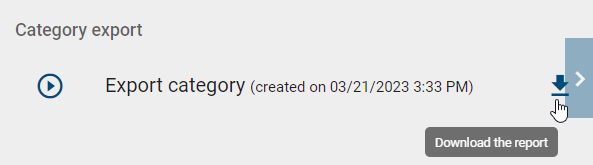
Once the export has been created, you will find a Download the report button in the Reports & Exports section of the Options panel. There, you can download the export.
Gallery
When you open the Diagrams section from the menu, you can switch to the Gallery in the main area.

In the gallery, you have the option to preview all diagrams from a selected category. Furthermore, the diagram name in the current content language, the diagram type in the current browser language, and a preview image of the diagram are displayed. If the category explorer is open, you can close it to enlarge the diagram preview.
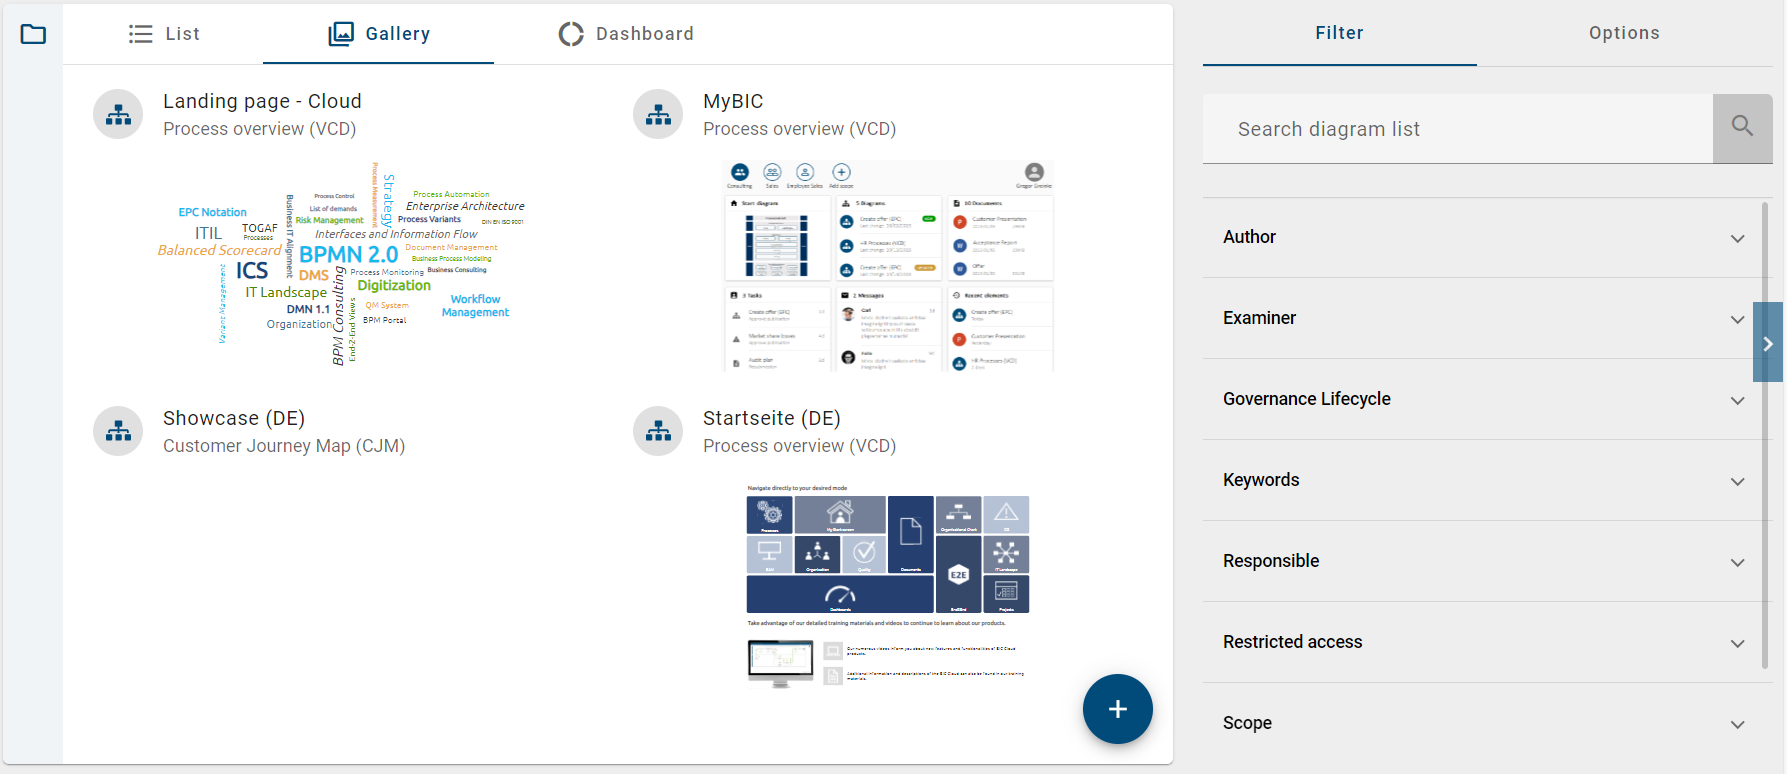
The right sidebar shows the filter. If you select one or more facets there, the charts will be updated to count only the diagrams which satisfy the filter criteria.
If you have activated one or more facets in the filter and switch to another view, the filter will remain active, and only the filtered diagrams will be displayed in the list.
Hint
Please be aware that the options Import and Bulk update are not available in the Gallery view.
How can I analyze diagram attributes in the dashboard?
If you open the Diagrams section using the menu, you can switch to the Dashboard in the main are of your screen.
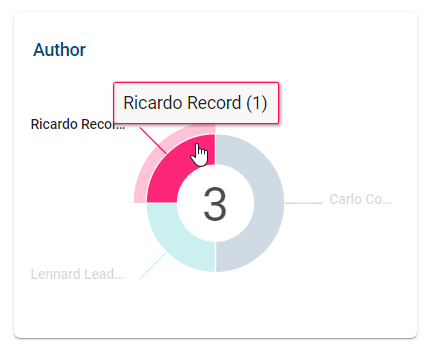
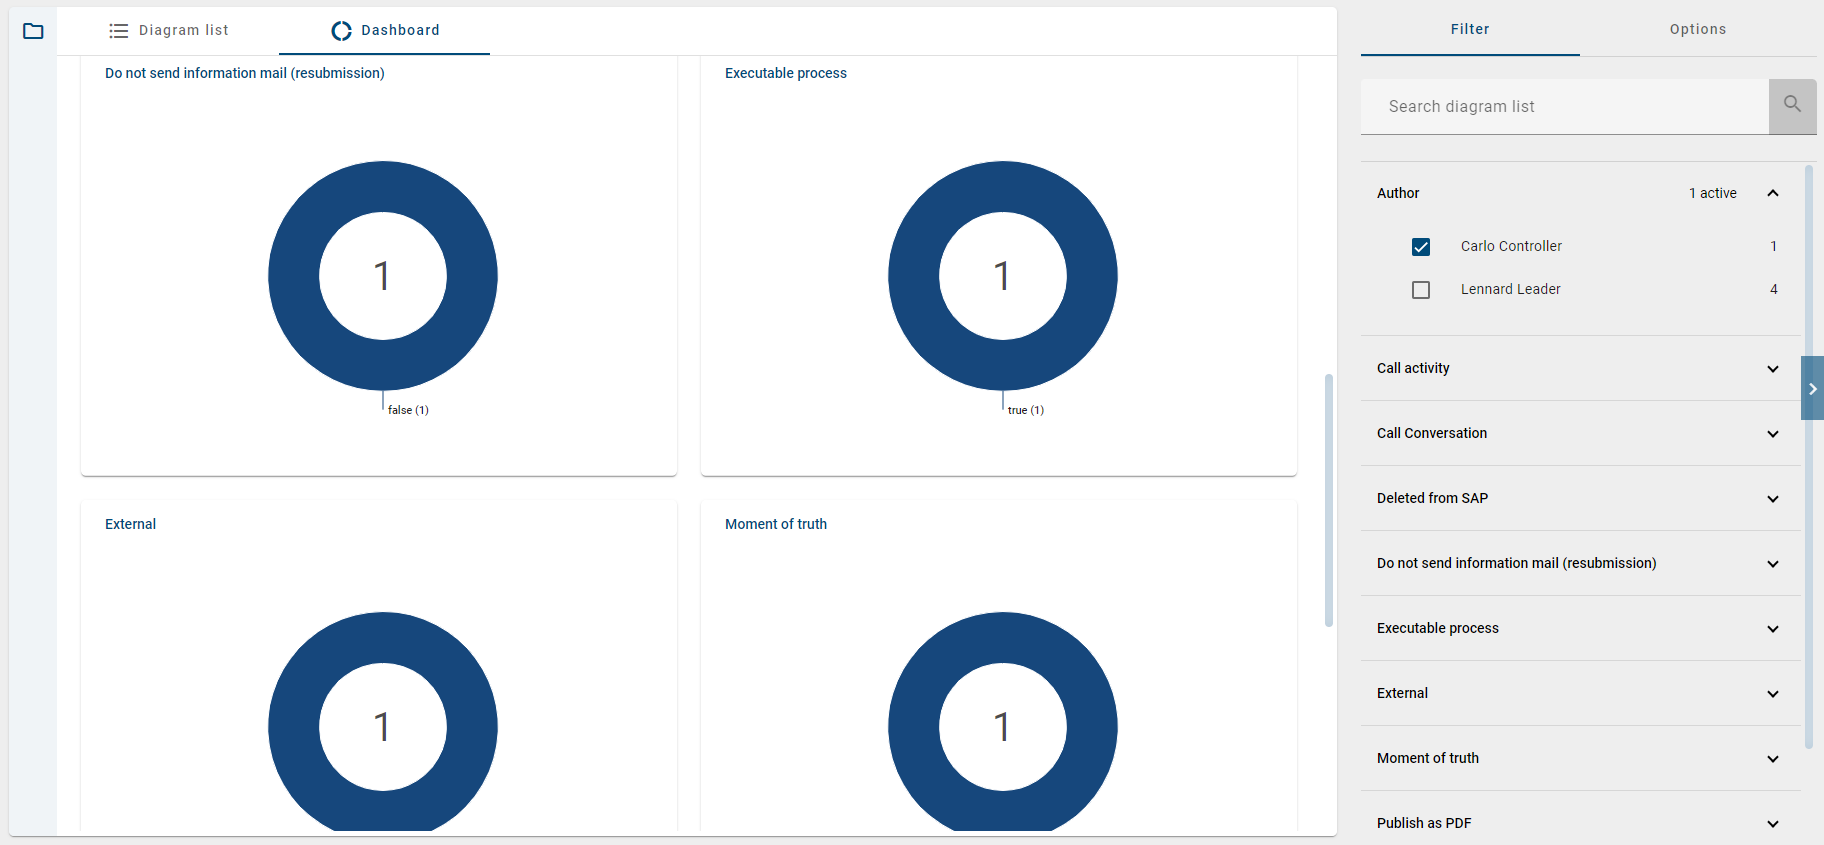
The dashboard view enables you to analyze the diagram attributes of all diagrams contained in your current repository. A donut chart is displayed for each available diagram attribute type. An attribute type is available as soon as it is set visible in the method and is maintained in at least one diagram. The number in the middle of a chart tells you how many different facets of the attribute are currently present in the repository.
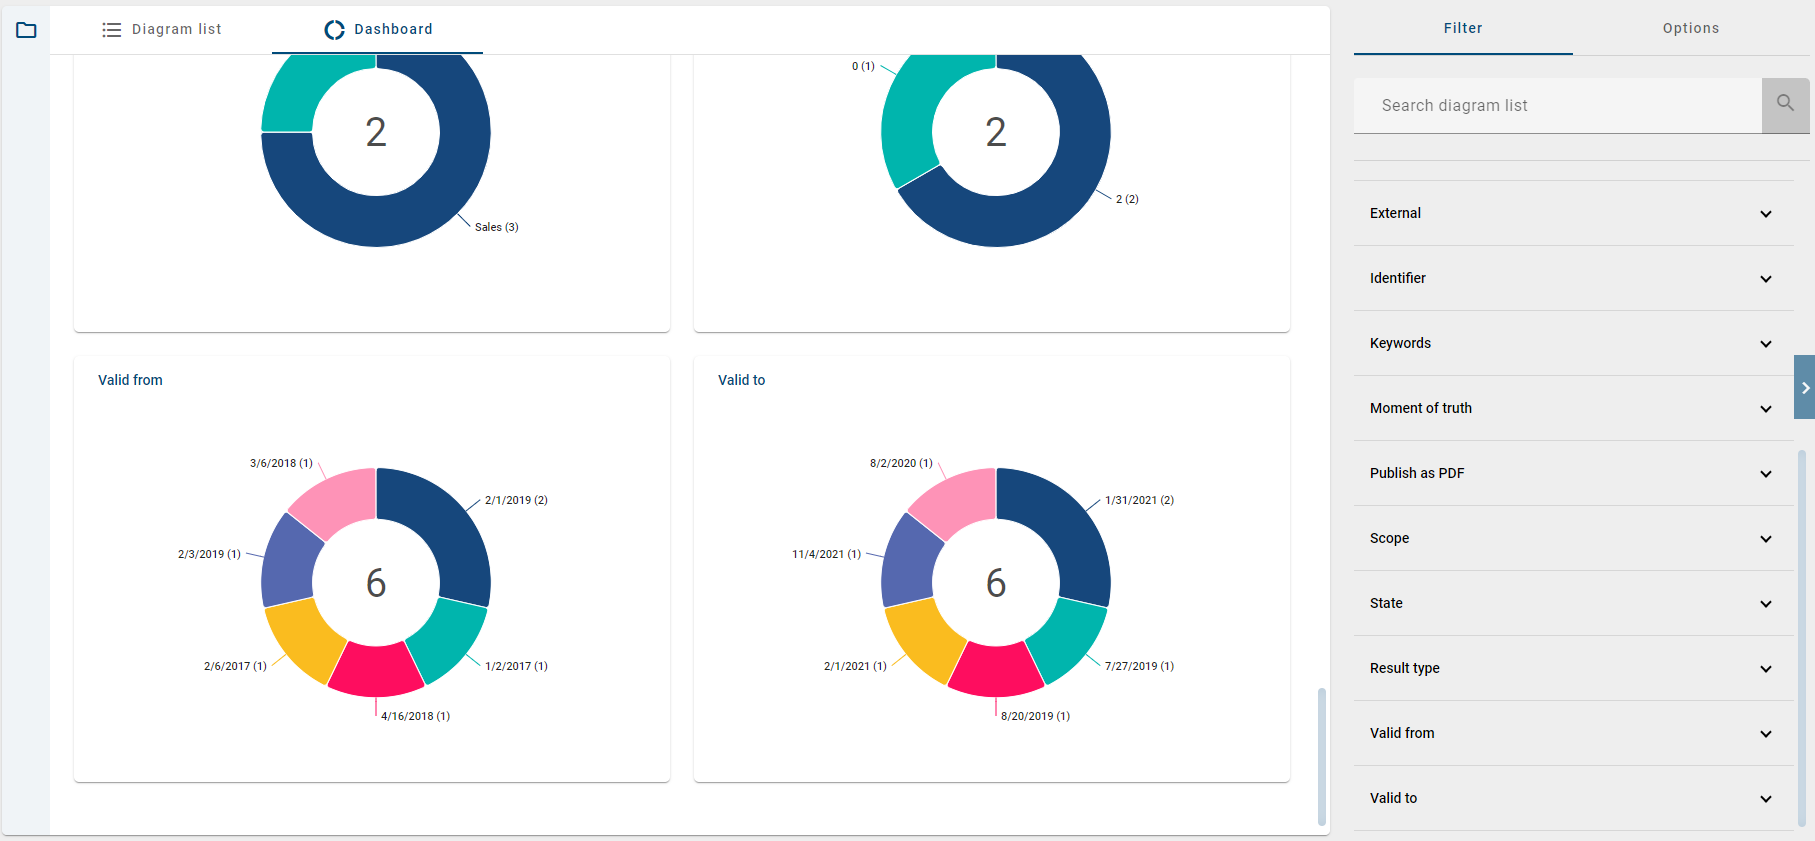
The right sidebar shows the filter. If you select one or more facets there, the charts will be updated to count only the diagrams which satisfy the filter criteria.
Vice versa, you can select one or more facets of a chart in order to filter for a characteristic.
If you activate one or more facets in the filter and switch to another view, the filter is still active and only the filtered diagrams are listed there.
How can I return to a recently opened diagram?
If you are in a diagram view, you can return to a recently opened diagram by clicking the option located to the right of the process execution view. This option is only available if you have previously opened at least one diagram.
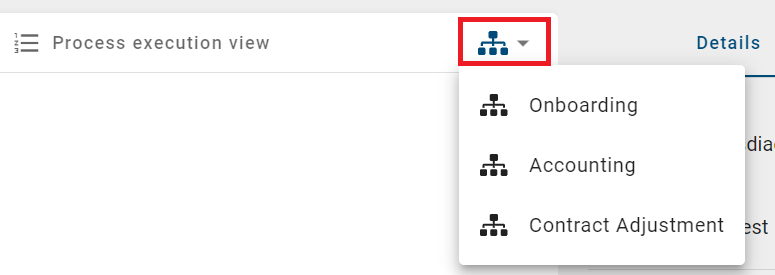
The list of recently opened diagrams is sorted chronologically in descending order and is limited to a maximum of five entries. If you have opened more than five diagrams recently, the oldest entry is removed from the list and the most recently opened diagram is added.
After clicking on a recently opened diagram, you will return to this diagram in the stage you have last opened.
Search and filter diagrams
How can I search for diagrams?
If you open the Diagrams menu item in the left menu bar, all diagrams that are stored in the current repository as a directly parent category are listed in the main area. You have the option to search for diagrams by using the search function in the diagram list.
The search compares the term entered with the titles of existing diagrams and displays the corresponding results. The search results may also include access-restricted diagrams that you cannot open.
Click on the Search diagram list field in the Filter panel at the top right. Enter the search term and confirm by pressing the Enter key or clicking on the magnifier glass.
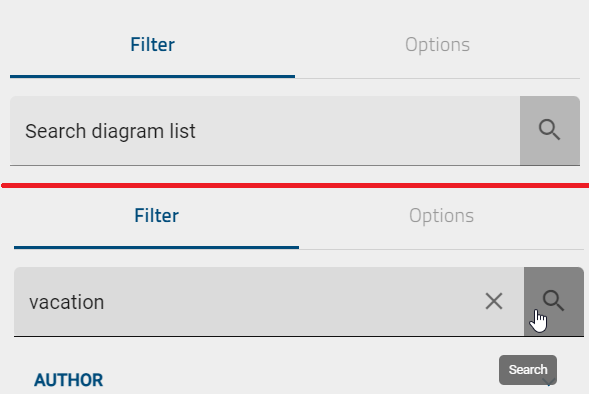
All search results containing the entered term will then be displayed in descending order of relevance.
If no matching diagrams are found for your search term, a message will appear in the main area along with the Toggle language & search again button. You can use this button to switch to the alternative content language and repeat the search.
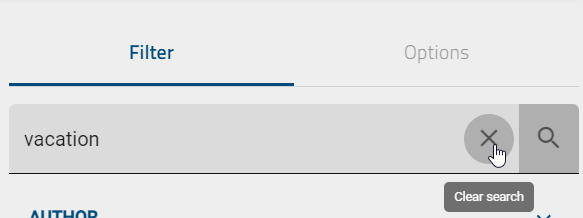
To display the entire diagram list again, click Clear search next to the magnifying glass icon to reset the list.
Hint
Here you can find an overview of the various options available for search terms.
Warning
Please note that searching for access-restricted diagrams or for catalog items within access-restricted diagrams is only possible for their governance participants. This also applies if you have the Administrator user role. Changes to users or user groups in the Administration may cause access restrictions to stop working correctly. Therefore, make sure that user and user group information in the administration and the catalog is maintained consistently.
Hint
Please note that even when using additional filters, the search results are still sorted according to their relevance. Only the diagrams that match the selected filter criteria will be displayed.
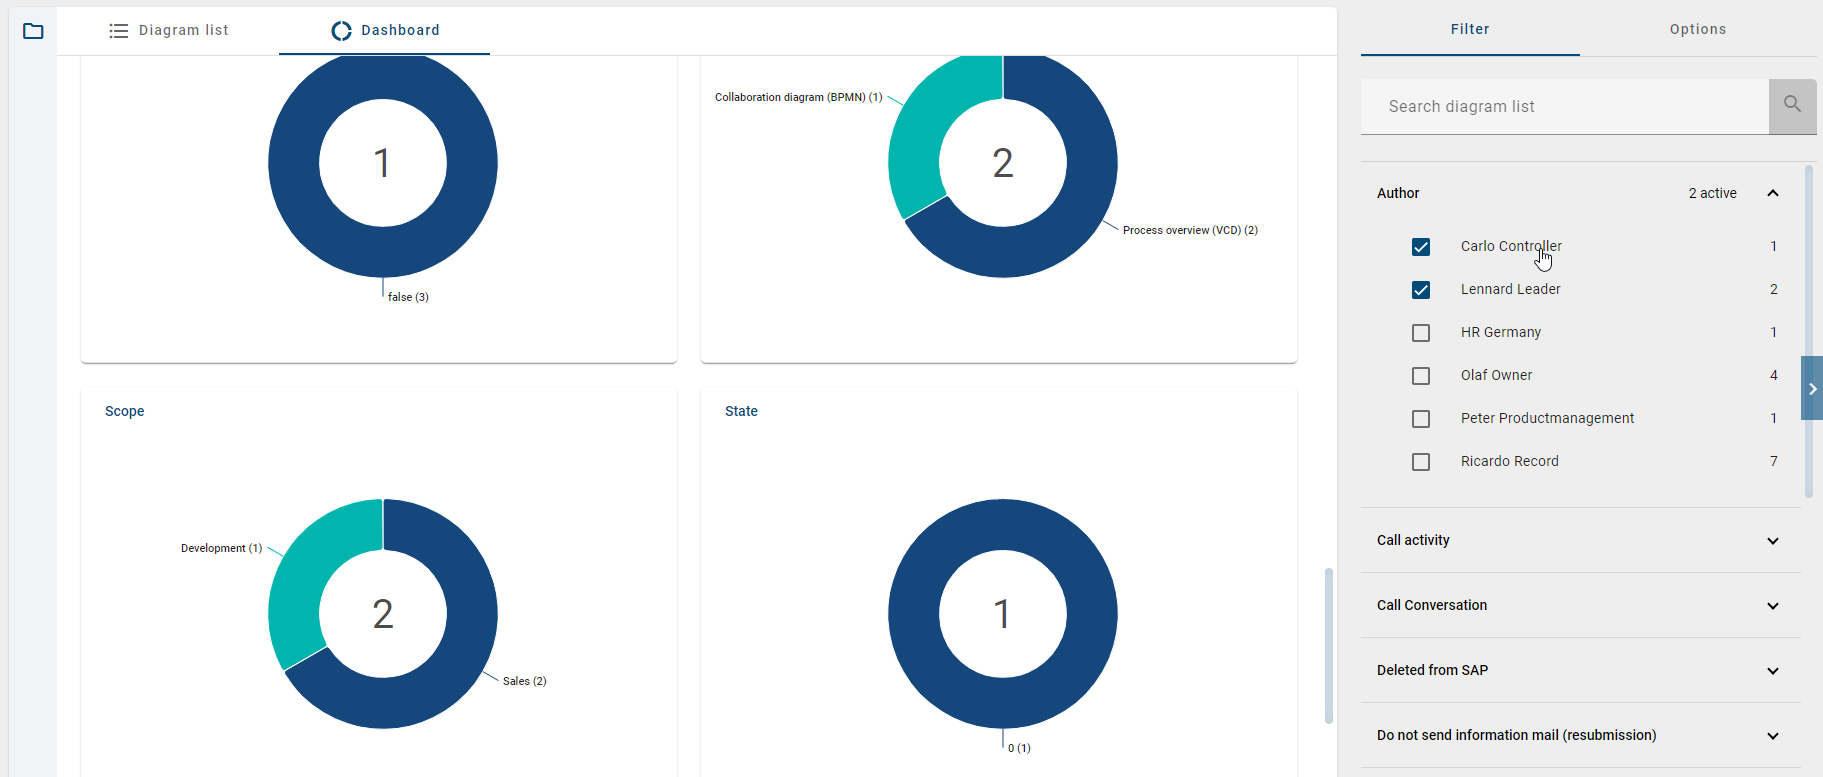
How can I filter the diagrams?
If you open the Diagrams menu item in the left menu bar, all diagrams that are stored in the current repository as a directly parent category are listed in the main area. You have the option of filtering the entries both in the diagram list and in the dashboard. If necessary, switch to the Filter panel in the right sidebar.
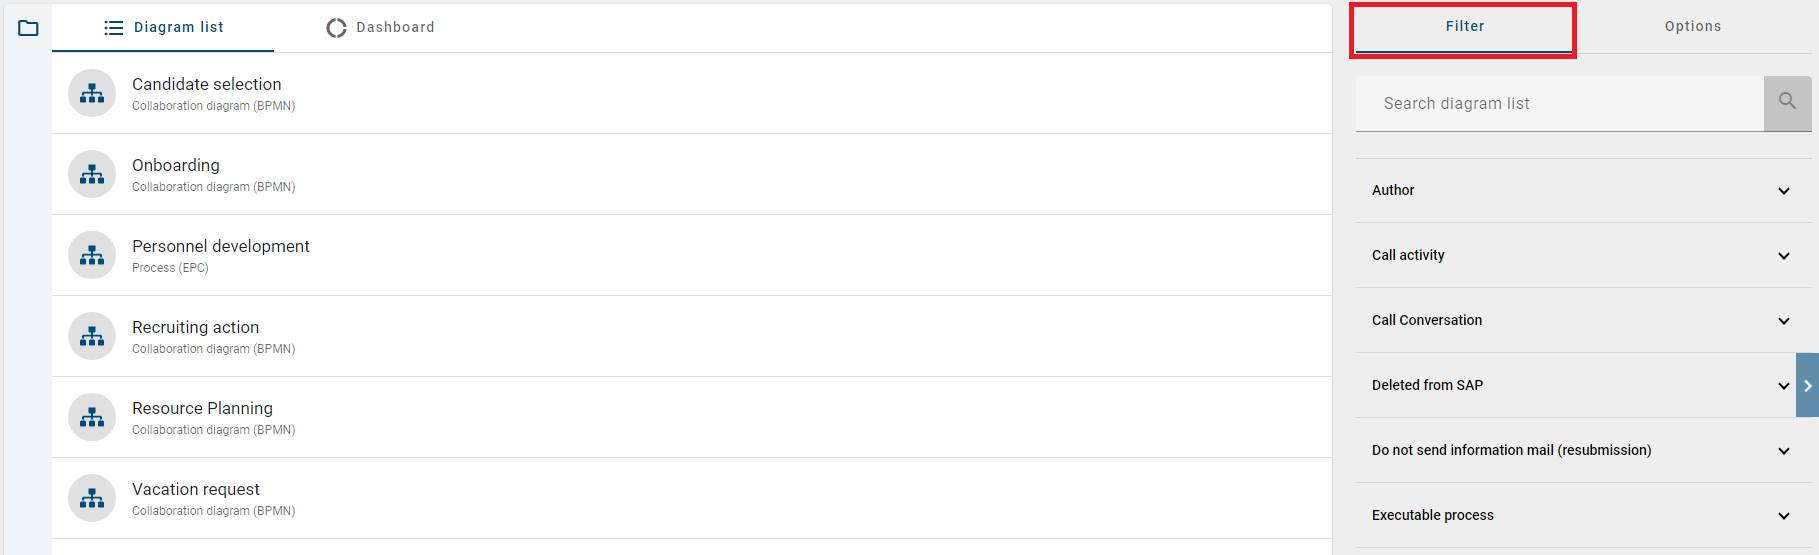
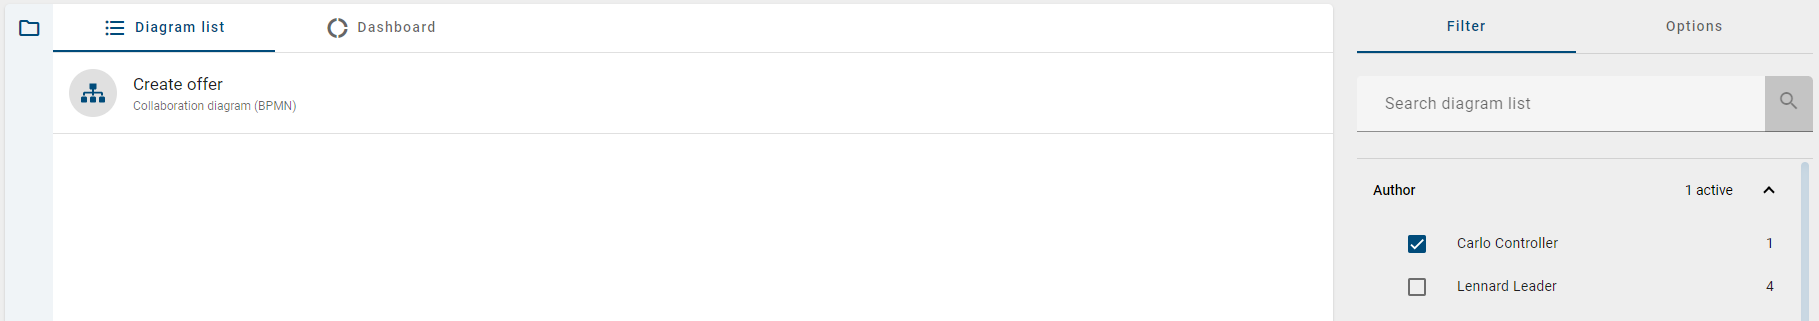
All attributes that you can filter for in the current repository are listed there. Click on an attribute to open all facets of the respective attribute. Here you can select which facets you want to filter by. You have the option of filtering for several facets at the same time. The diagram list or dashboard is updated immediately and shows the diagrams according to your selection in ascending alphabetical order by name in the current content language. If you have activated one or more facets and switch between the List and Dashboard view, the filter remains active and only the filtered diagrams are displayed in the other view.
Filtered diagram list:
Filtered dashboard:
If you remove all filters or click on the entry diagram again all diagrams will be displayed in the list resp. dashboard again.
Tip
If you have user rights Reviewer or higher, you can use the additional filter facet diagram views.
How can I filter diagrams by their current state?
With the Governance Lifecycle filter, you can filter diagrams according to their currently active workflow, their publication or their revision. This gives you a better overview of the status of the diagrams.
If you want to apply this filter, you must be in the Public workspace. In the Filter tab, you can open the Governance Lifecycle filter.
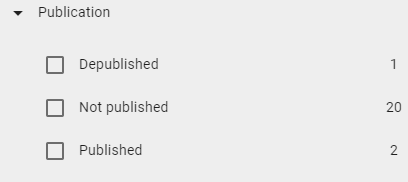
Publication
If you open the Published subfilter and at least one diagram has been published, you can filter for the corresponding diagrams by clicking on Depublished, Not published or Published.
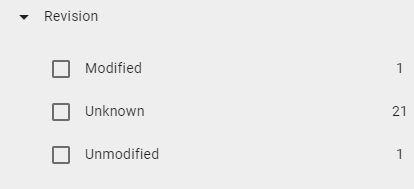
Revision
If the Revision subfilter is expanded and at least one diagram has a revision status, you can select a specific revision status as a filter. You can filter diagrams according to the following revision statuses: Modified, Unmodified and Unknown. Changes to a diagram cannot be displayed until it has been republished. Until then, it has the revision status Unknown.
Workflow
If you have expanded the Governance Lifecycle filter, you also have the option of opening the Workflow subfilter. Here you can then filter whether a workflow is active for the diagram. A distinction is made between Depublication, Publication and Resubmission.
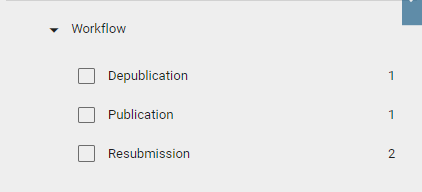
You will then see a filtered list and a number of all diagrams that are in the corresponding area.
Hint
The Governance Lifecycle filter is available from version 7.14.0. To display all published diagrams in the filter, you must check the diagrams out and back in at least once.
Note
All filtered results are sorted alphabetically by browser language.
Hint
The Governance Lifecycle filter is also available to filter catalog items by their Workflow, their Publication or their Revision.
How can I add attributes to the diagram list view and get a table view?
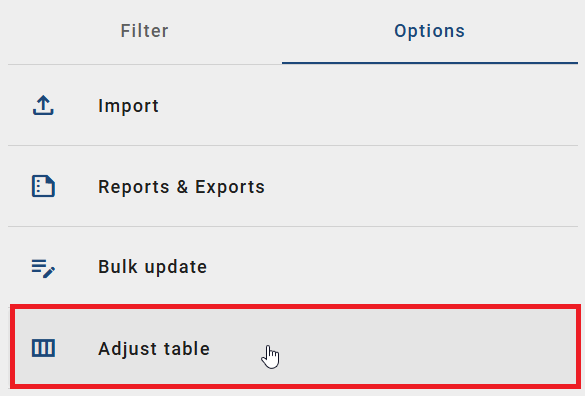
Each user has the ability to add attributes to the diagram list view to create a table view. To do this, navigate to the Diagrams menu item in the left menu bar and, if necessary, switch to the Options panel in the right sidebar. There, you will find the Adjust table option.
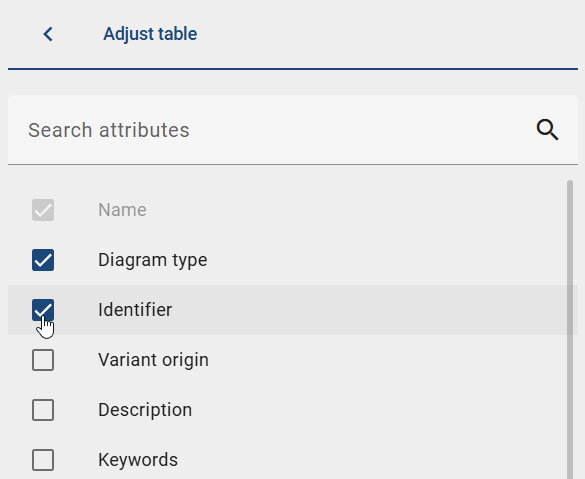
After clicking this option, a list of all available attributes sorted by attribute type will appear, which you can add to the diagram list view. A selected attribute will be marked with a checkmark. If you cannot immediately find a specific attribute, you can use the search bar to look for it. The search is not case-sensitive.
Once you have selected at least one attribute, it will immediately appear as a new column heading in the diagram list view in your active browser language. The content for each diagram will be displayed in the active content language. If an attribute value is only available in the alternative language while your content language is active, the content from the alternative language will be shown. If the attribute value is not available in any language, the content for the corresponding diagram will remain empty. Alternatively, the content will be empty if the attribute type is not assigned to this diagram type. To find out the exact reason for the empty content, hover your mouse over the empty entry.
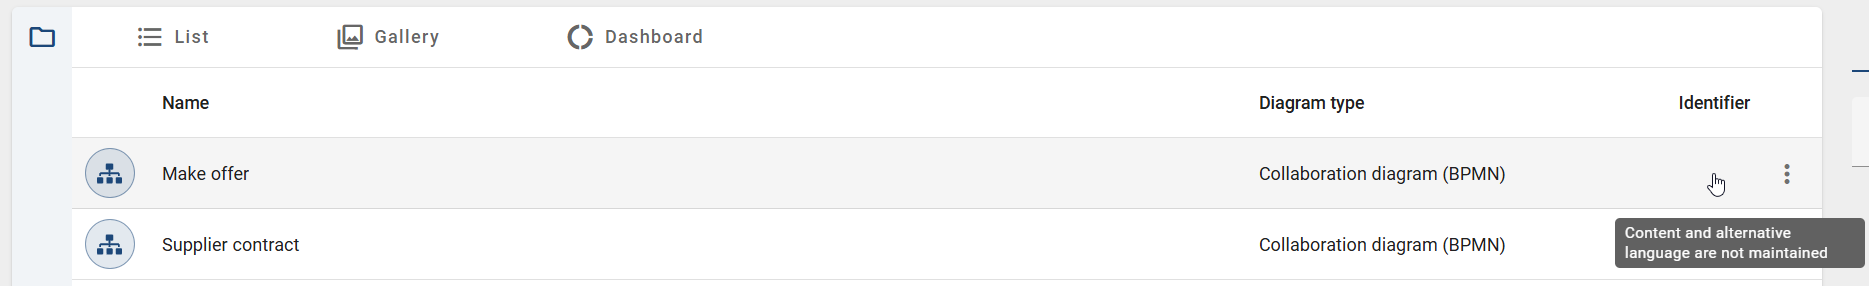
If the number of attributes displayed exceeds the capacity of the desktop view, a horizontal scrollbar will appear, allowing you to scroll through the various attributes. Your customized table view is saved and will be shown the next time you access the diagram list. You can modify the display of attribute values at any time.
Note
The Name attribute is always displayed and cannot be changed.
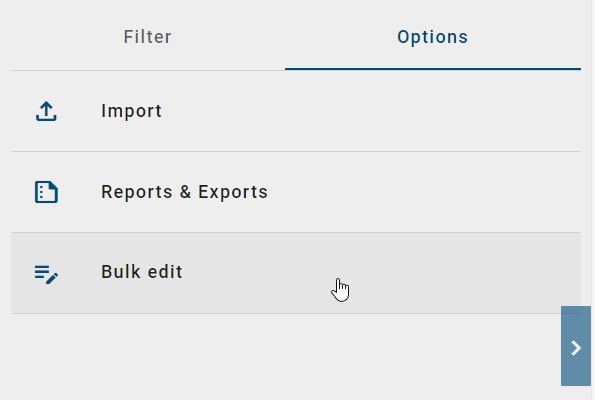
Bulk Update
If you want to update the same type of attributes in multiple diagrams as an administrator or editor, you can do so using the Bulk Update feature. To do this as an editor, navigate to the Options of the diagram view while being in the Public Workspace. Alternatively, as an administrator, select any stage and select Bulk Update.
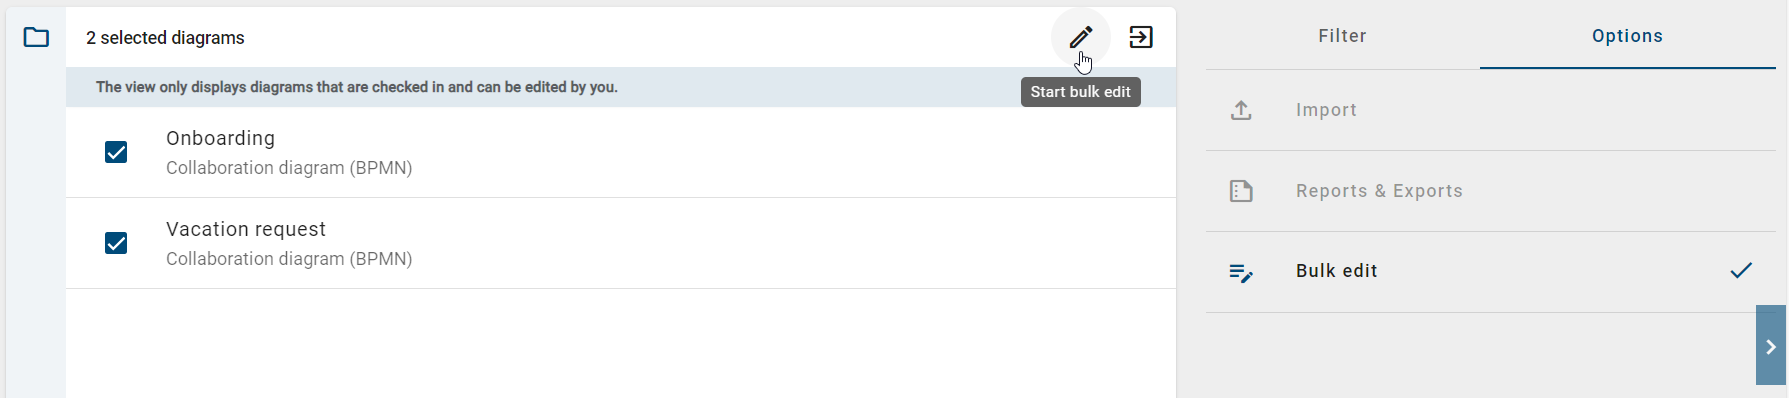
Subsequently, you will enter the Bulk Update mode for the respective category in which you are currently located. All (filtered) diagrams within the category will be displayed to you in a list view. Select the diagrams you want to edit, and click on Start bulk update.
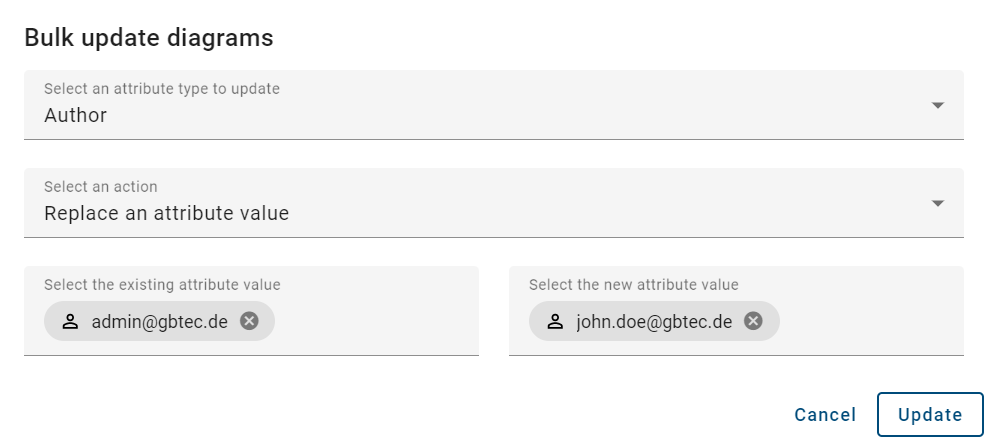
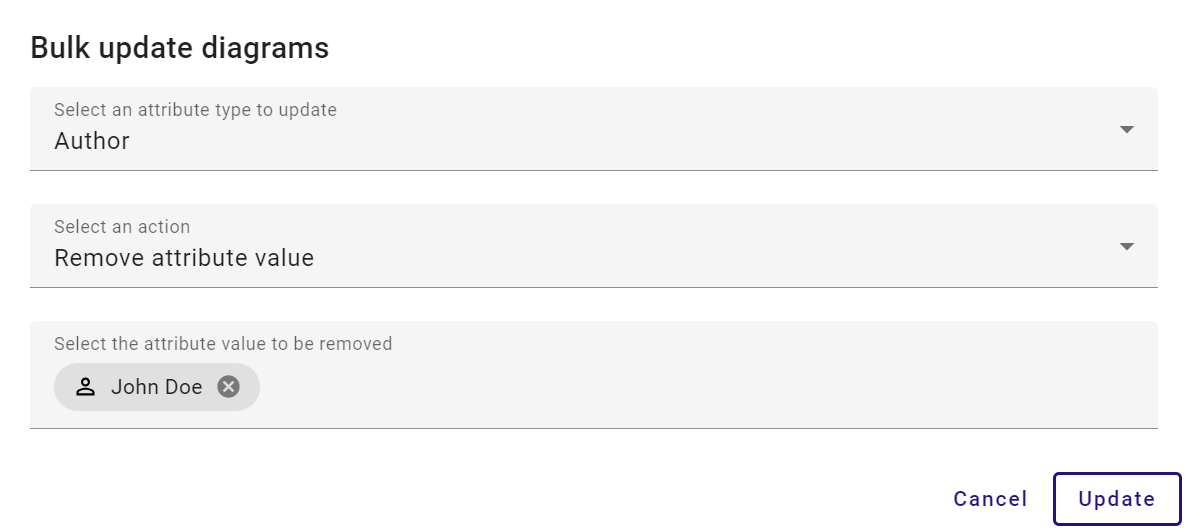
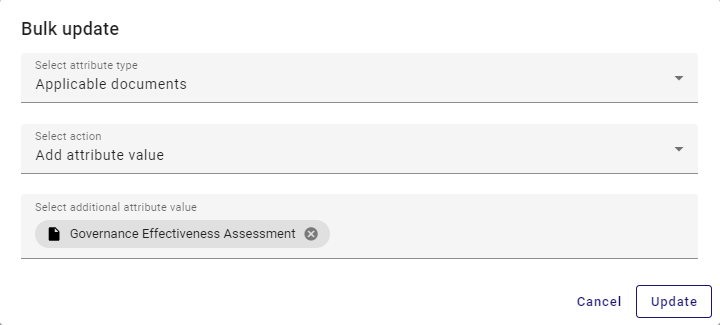
This will open a dialog where you first need to choose the attribute type you want to edit. Once you have selected an attribute type, you can specify whether the attribute value should be replaced, removed, or added. Depending on the selected action, one or more input fields for the attribute value will appear. You can make an entry here, and the matches for the selected attribute type will appear in your current stage and be selectable.
Replace an attribute value:
If you want to replace the attribute value, enter the existing and new attribute value to replace the existing one.
Remove attribute value:
If you want to remove the attribute value, specify the attribute value you want to remove.
Add attribute value:
If you have selected a multi-value attribute and open the action menu, specify the attribute value you want to add.
Hint
Please note that if you add another attribute to a single value attribute type even though a value already exists, the affected diagram will be skipped during Updating. After the Update, you can download a JSON file from the bottom right corner of the screen. In the downloaded JSON file, the affected diagram appears under Diagrams not updated, including the corresponding diagram ID, the name in the content language you selected, and the specified reason.
Click on Update to apply the changes, or on Cancel to discard any changes.
Once you click on Update, a confirmation window will appear. Here, you must enter the word update to confirm the bulk update.
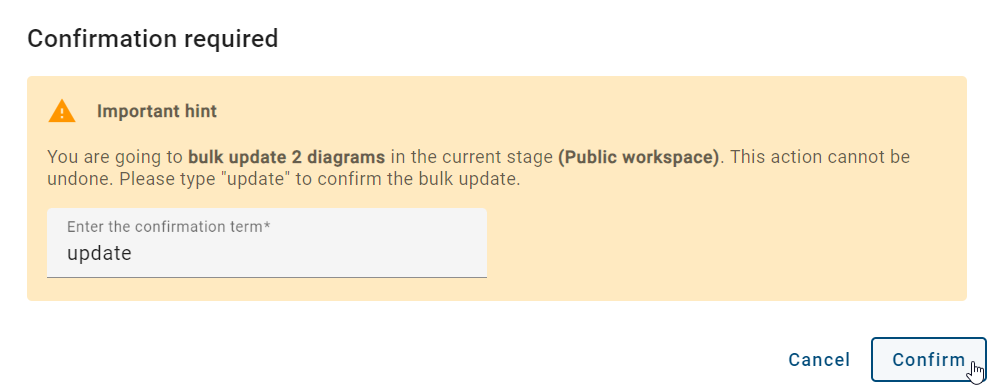
After successfully updating the corresponding attribute values in the selected diagrams, a success message will be displayed. The change workflow will be listed for diagrams in the Preview and Publication in the Governance Cockpit with the specified reason. If the update is unsuccessful, an error message will be shown.
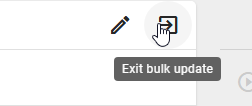
If you want to exit the bulk update, click the Exit bulk update button.
Which alternative views on diagrams are available?
When you open a diagram, you first go to the diagram view. Here the diagram name is always displayed in the headline and the diagram version of the current stage is presented.
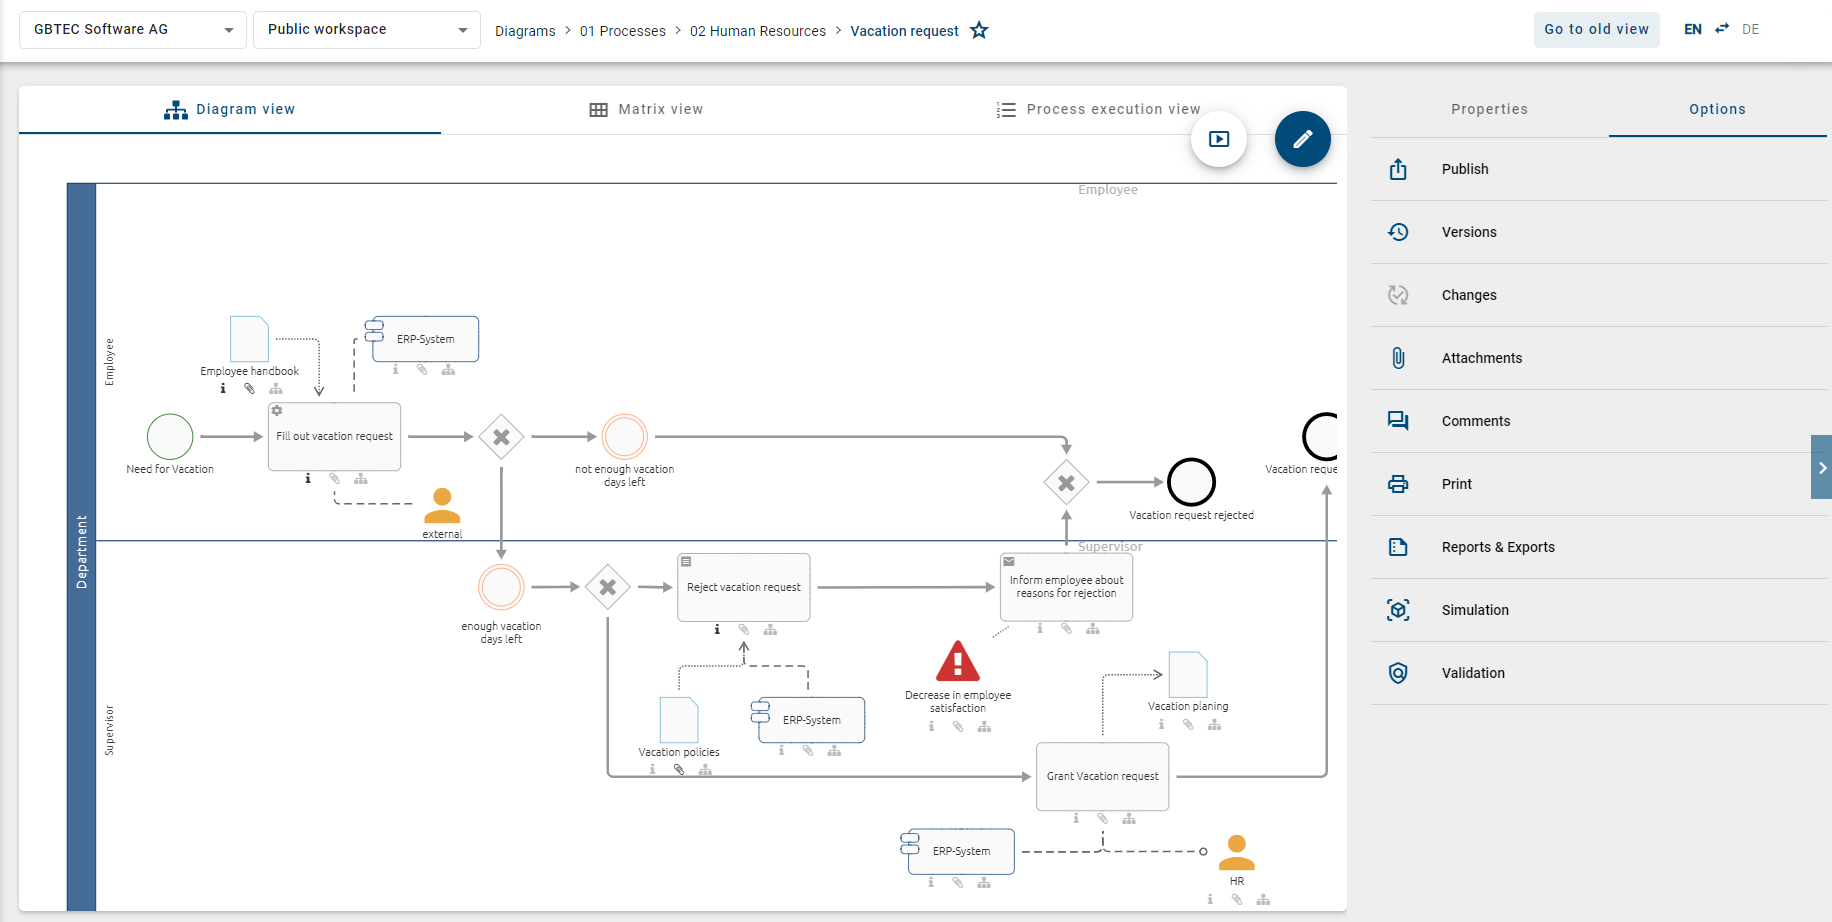
In addition to the diagram view, you can view the matrix (1) and the process execution (2) here for the diagram types “Collaboration diagram (BPMN)” und “Process (EPC)”. The matrix is also available for the “Process overview (VCD)”. All these alternative diagram views refer to the same diagram version. Depending on the current view of the diagram, you have different options, which you can find in the sidebar on the right.
The different diagram views and their options are explained in more detail in the following chapters.
Diagram view
How do I get to the diagram view?
This view is initially set if you have opened a diagram and presents the diagram version of the selected stage. The graphical representation of the diagram is always svg-based.
If the diagram view is not opened, you can display it by clicking on Diagram view.

Note
The graphical diagram view offers you an easy handling over the left mouse button, known from Google Maps.
How can I view the details in the diagram view?
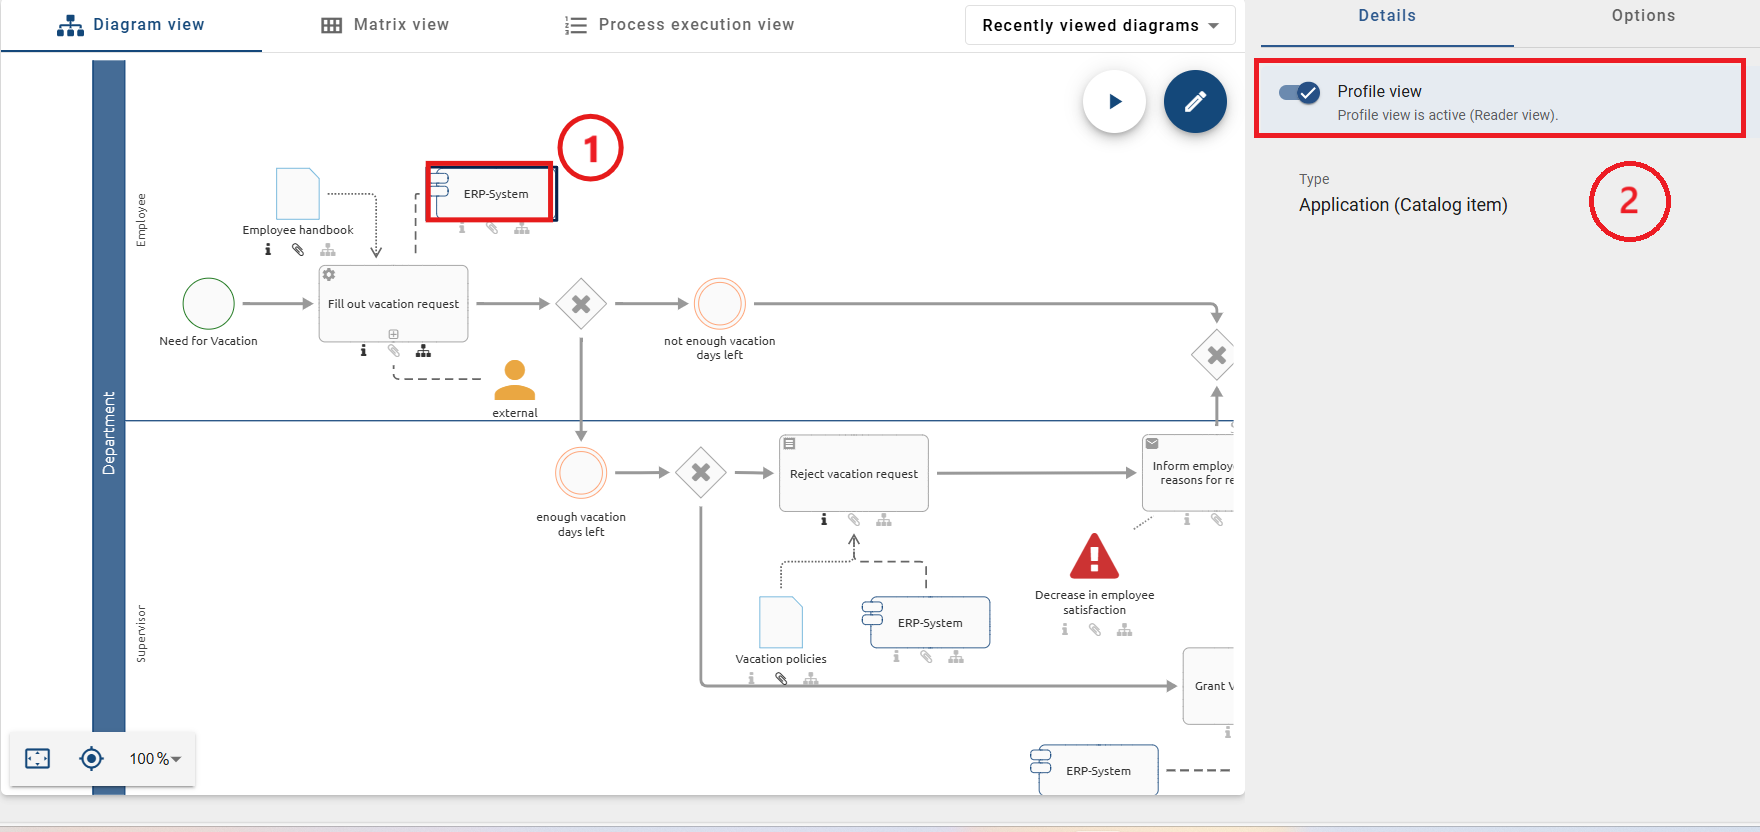
In the diagram view, you will see the Details of the diagram in the right sidebar by default. If these are not open, open the right sidebar if necessary and switch to the Details. Here you can choose between Profile and Attributes. By default, the Attributes view is open when you open the Details tab. However, you can activate the Details view by clicking on the slider.
Profile:
The profile view shows information set by the Administrator for an object. First select an object from your diagram to display Profile panel in the right sidebar. All user roles have access to Profile.
To configure the profile, you must navigate with the user role Administrator in the left menu bar to the Administration menu item and then to the tile Details. After you have clicked on the tile, switch to Object types. Select any object type and expand its details by clicking on it. Then activate the Display profile view slider. All activated Object types are now added to Profile in the diagram view.
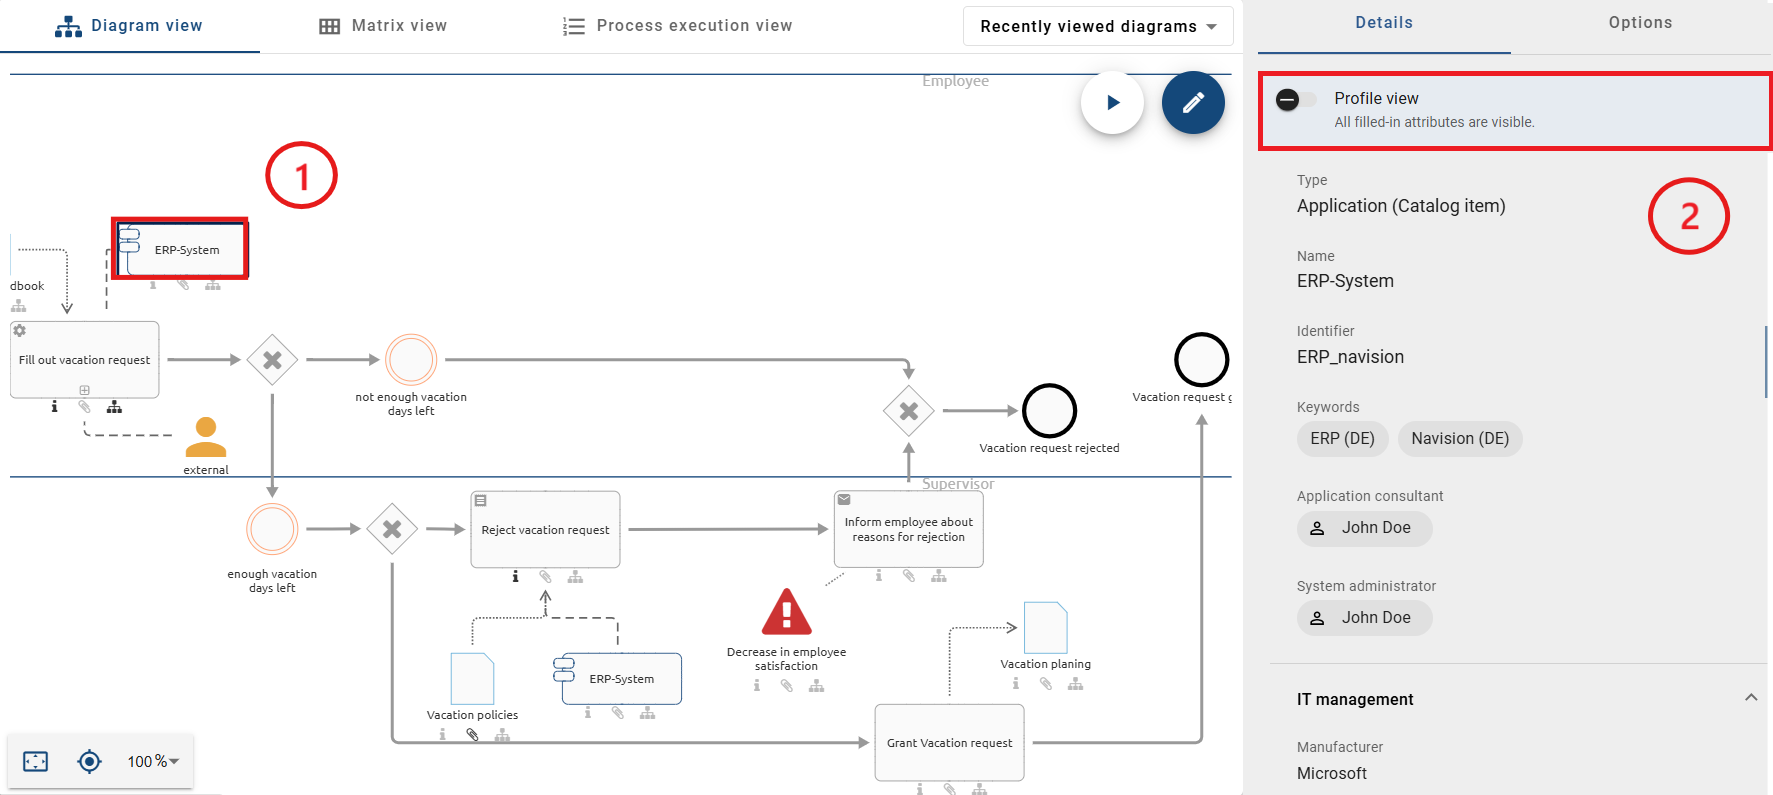
Attributes:
The Attributes view displays all attributes of a selected object or diagram. All user roles, except the Reader, can access the Attributes tab.
If you want to view the attributes of an object, first select the object from your diagram to display the Attributes panel in the right sidebar. To view all the completed Attributes of the diagram, simply click on the Attributes panel without selecting any object first.
You can find an explanation of which contents are displayed to you as details in the corresponding chapter.
Hint
If you have opened the Atrribute tab, this view will be saved and displayed again the next time you log in.
Note
If the profile view is deactivated in Administration, all users will only be able to see the attribute view in the diagram details. If the profile view is activated in Administration but no profile has been configured, users with the Reader role will not have access to the Details.
Which options do I have in the diagram view?
To display the options of the diagram view, click on Options in the right hub.
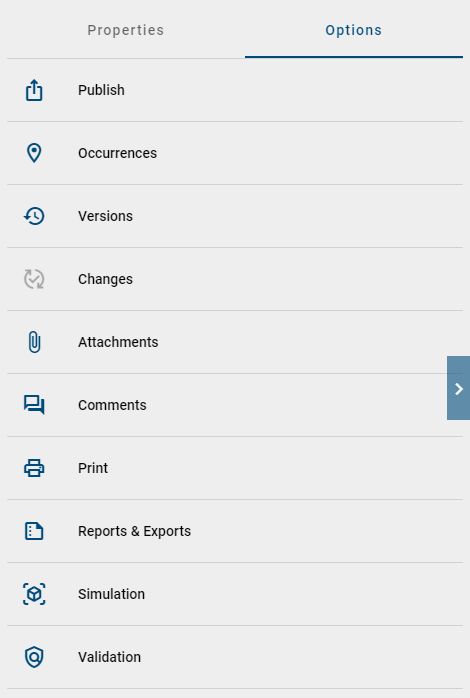
The following options are now available for diagrams or symbols and the corresponding chapters are linked for further explanation:
Occurrences (only for symbols)
Simulation (optional)
Once you have opened one of these options, you can use the back arrow in the sidebar to navigate back to the main options menu.
Tip
If a symbol has an attachment, you can also display it by double-clicking on the symbol.
Matrix
How do I get to the matrix?
You only have the option to display the matrix, if you have opened a VCD, EPC or BPMN diagram in the repository. Then click the Matrix view button.

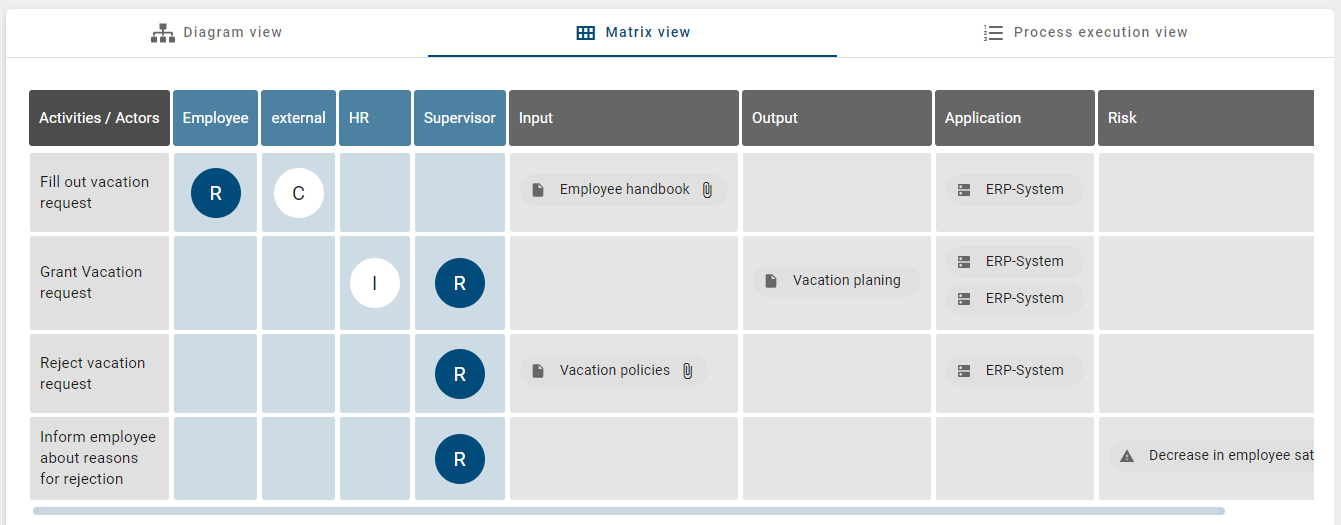
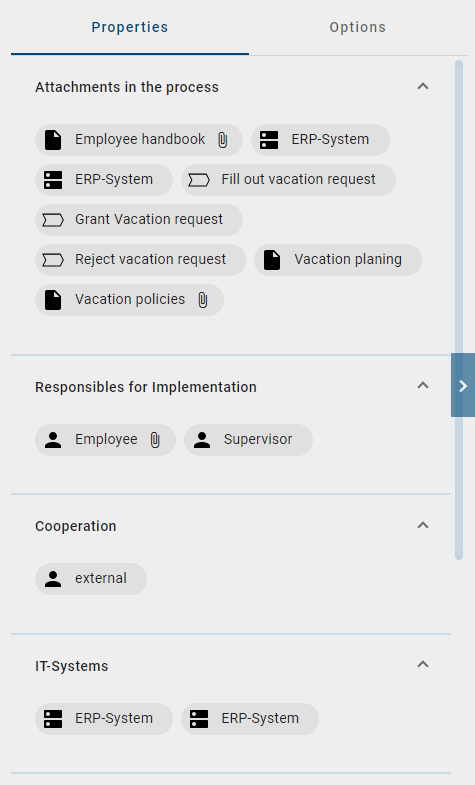
Depending on the process flow (BPMN and EPC), or depending on the location on the diagram (VCD), the matrix displays all the activities of a diagram in rows. All actors, such as roles and responsible applications (e.g. pools), form the columns in alphabetical order. In the matrix cells, the association type between the activity and the resource is displayed (R-Responsible, I-Informed, C-Consulted, A-Accountable). The following columns are about inputs, outputs, applications and risks of the diagram. The objects associated with an activity are then listed alphabetically as chips in the corresponding field. If an attachment exists for an object, the chip contains a paper clip symbol. By clicking on this paper clip, attachments can be accessed directly. See the profile for a more detailed description.
You also have the option of viewing all modeled relationships between a role and an activity in the matrix view. If the same role has several relationships to an activity, all of these relationships are displayed in the matrix view.
Note
The matrix is not available in the mobile view.
How can I view the details in the matrix?
In the matrix, the hub on the right shows the Details of the diagram by default. If they are not displayed, open the right sidebar if necessary and switch to the details.

By clicking on activities or chips of the matrix, the associated details are automatically displayed in the options. Here you can choose between Profile view and the Attributes view. This selection can be deselected in the desktop version by clicking again, so that you now see the details of the diagram.
You can find an explanation of which contents are displayed to you as details in the corresponding chapter.
Which options do I have for the matrix?
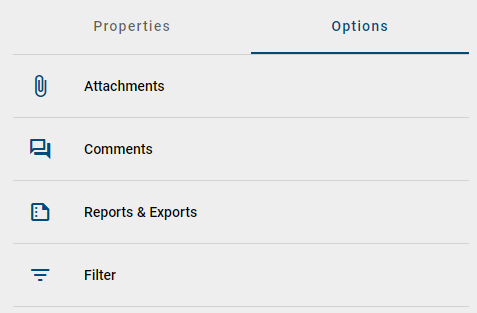
To display the options of the matrix, click on Options in the right hub.
The following options are now available and the corresponding chapters are linked for further explanation:
Once you have opened one of these options, you can use the back arrow to navigate back to the main options menu.
How do I filter the matrix?
Looking at your diagram in the matrix view you can use the filter option. If you click on filter, the column headers of the matrix are shown as filtering options. An eye icon on the left side of a column header displays its visibility. Every column is visible initially.
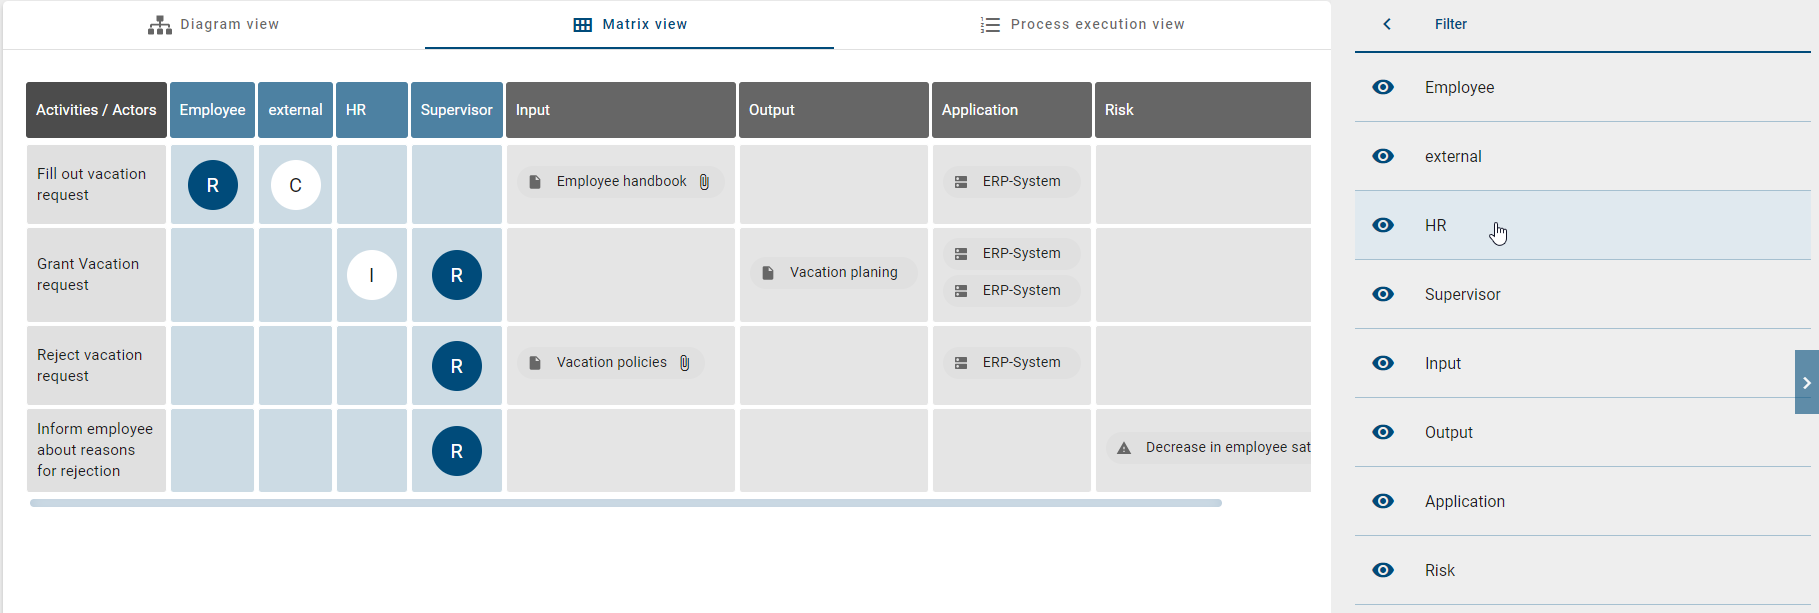
You can deselect a column of your matrix by clicking on the corresponding header. The column is not visible anymore and the header as well as the now crossed out eye icon are greyed out.
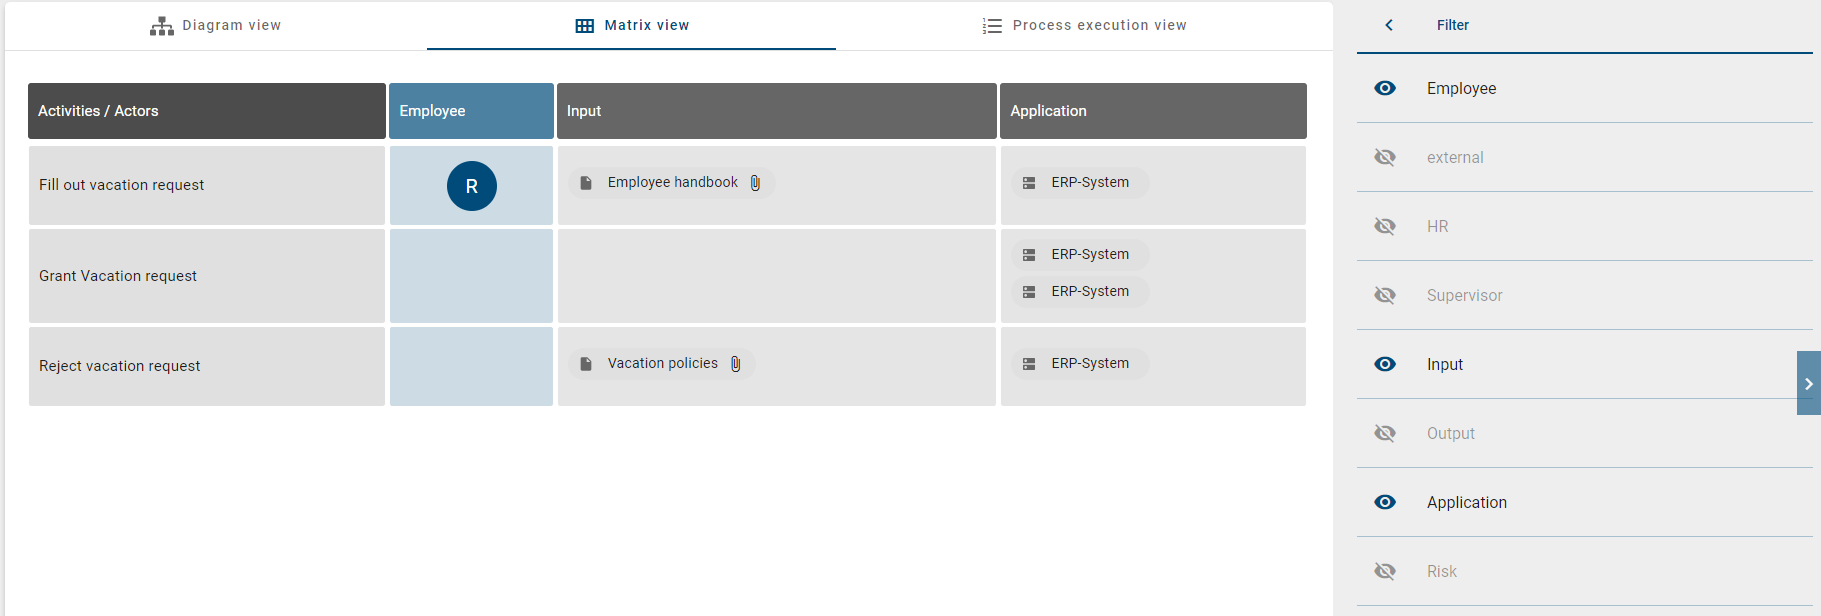
Another click on the column header enables the visibility again. If you navigate back to the main options menu using the back arrow, the filter is reset. All columns are displayed again.
Process execution
How do I get to the process execution?
You only have the option to display the process execution view, if you have opened an EPC or BPMN diagram in the repository. Then click the Process Execution button.

Based on your modeling in the Diagram view, you can now see the process execution in the middle of your screen. The activities, decisions and related events are listed here.
The activities represent the individual tasks in the process. Below each activity name, the responsible resource is displayed if it has been modeled in the diagram. When you select an activity, you can use the options to display the details and thus obtain more information about the task.
The process flow means the sequence of activities and is initially determined by the software for the user. The decisions corresponding to the gateways in the diagram are made based on the probability of the process flow. The most probable process flow is automatically displayed. You can maintain the Probability for each activity in its attributes. If no probability has been maintained, the position of the node is decisive instead. Loops are not considered for automatic decisions. Overall, only the sequence flow forms the basis for the path.
The process flow is thus divided by the decisions into segments or sections, in which successive activities are placed. The activities are consecutively numbered starting with 1. The segments displayed depend on the decisions made. Each segment has its own background color for the activity numbers. The respective segment can also be identified by its heading, which includes the name of the gateway and the sequence of the selected path in the process. If a gateway was not named there, only the name of the sequence is displayed. If the sequence also has no name, you will see the name of the subsequent activity at this point. In front of the heading, the route icon belonging to the segment will always be shown. On the right of the headline you will see the Change decision button with which you can decide on your own and thus influence the following tasks. This is how a gateway can be noticed in the process flow, whereby a distinction is made between the following gateways:
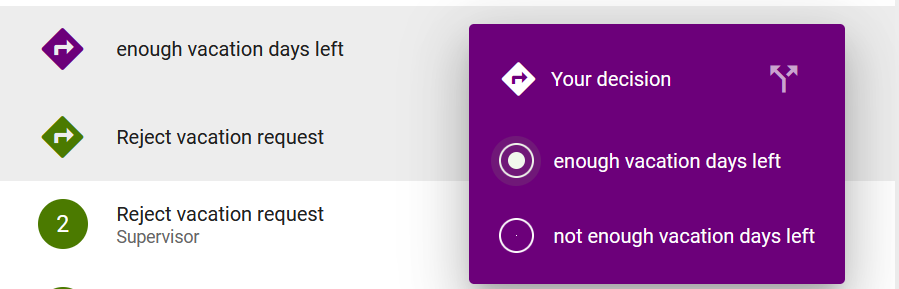
Exclusive or: By clicking on Change decision, a menu shows you all possible decisions. Here you can only select one alternative, which adjusts the list of subsequent activities. The section of an “Or” decision ends with the last activity before the next gateway or the end of the process. The background color of the numbering does not change within this segment.
Inclusive or: In this case, one possible path of the process is initially listed. By clicking on Change decision you can select another path or several paths at the same time. A path then corresponds to a subsegment. Within this segment, the numbering of each subsegment has the same background color in different transparency levels.
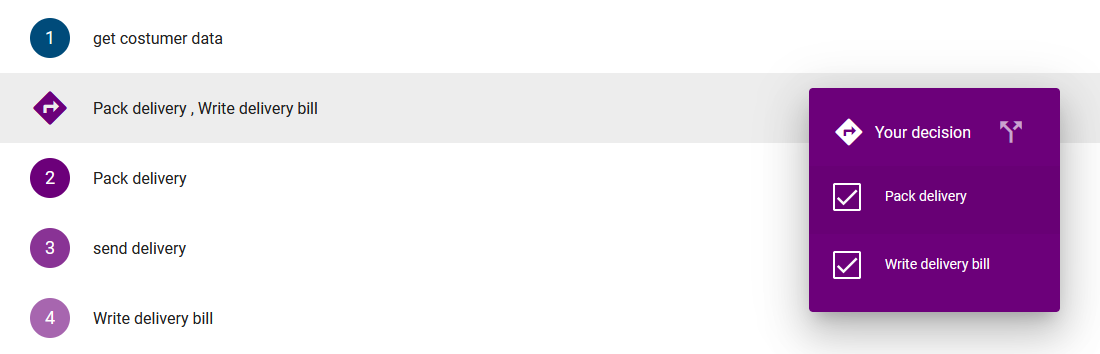
Parallel: In the case of an “And” gateway, all parallel paths of the process are listed one below the other, since all paths are executed. One path corresponds to one subsegment. Within this segment, the numbers of each subsegment have the same background color in different levels of transparency. Nevertheless, a decision can be made here by clicking on Change decision to highlight individual segments.
Note
Multiple starting points for the path are also displayed as an exclusive gateway above all activities.
Overall, the numbering is continuous across all segments and subsegments. The end of the process flow is marked by the corresponding event and by a flag instead of a number. If there is no end event but an activity at the end of the process, the end is inserted virtually and named accordingly, as shown below.

Further options to work with the process execution are described in the following chapter.
How can I perform process execution tasks?
To obtain an overview of the progress of a running process instance, you can mark the individual activities as completed in the process execution. This is only visible to you.
Navigate to the Process execution of the desired BPMN or EPC diagram. There you can see the activities to be executed and make decisions at gateways. For a detailed description please refer to the associated chapter.

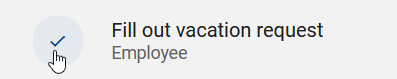
If you have completed a task, you can mark it by clicking on the number in the corresponding activity. There you will then see a check mark for the status “Done”.
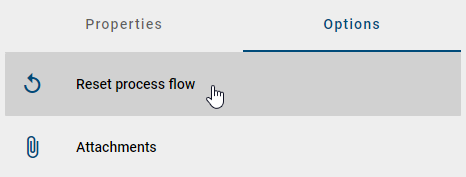
The tasks can be marked as completed in any order. To reset the status of the tasks, for example, after a complete run of the process, navigate to the Options and choose Reset process flow.
In addition, when a decision is changed in the process, the status of all subsequent and possibly already completed tasks is reset.
Tip
For an optimal work with process execution and extensive functionalities in dealing with process instances we refer to our product BIC Process Execution!
How can I display the details in the process execution?
In the matrix, the hub on the right shows the Details of the diagram by default. If they are not displayed, open the right sidebar if necessary and switch to the Details.
When you select a task in the process execution, the details associated with the task are displayed. Here you can choose between Profile+ and *Attributes.
You can find an explanation of which contents are displayed to you as Details in the corresponding chapter.
What options do I have for the process execution?
To display the process execution options, open the right sidebar if necessary and click on the Options button.
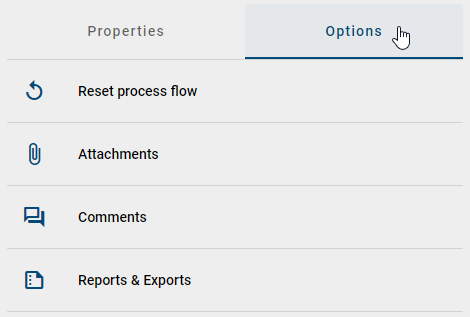
The following options are now available and the corresponding chapters are linked for further explanation:
Reset process: As a result, the status of completed tasks is “Open” again and decisions made are reset to the default setting.
Once you have opened one of these options, you can use the back arrow to navigate back to the main options menu.
Options in a diagram
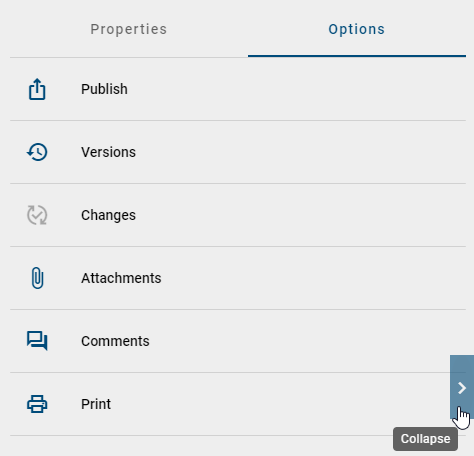
When you open a diagram, more Options are displayed by default in the hub on the right. A selected view in this bar remains in the desktop version after reloading. You can also Collapse and again Expand the sidebar. To do this, click on the button having the same name in the desktop version, which is located in the middle of the right edge of the screen. This setting is stored in your account, which means the hub will always remain closed or opened until you change it manually. This applies to any view changes, such as diagram switching or switching to Matrix or Process Execution.
Instead, in mobile view, you will find a 3-dot context menu in the top right corner of the screen to display the options. After clicking on an option, it will be displayed full-screen on the screen. To return to the diagram, click the X icon in the top left corner.
The options depend on the current view of the diagram. To find out which options are available in your open view and where you can see them, navigate to the corresponding chapter for the diagram view, matrix or process execution.
What is displayed in the diagram as attachments?
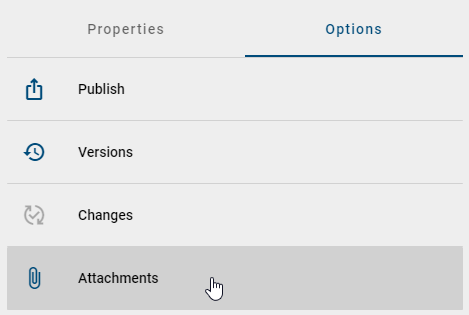
You have already navigated to the Options of a diagram in the hub on the right. There you can open the Attachments.
The attachments are divided into two different sections: Files and links. Both sections can be expanded and collapsed. In addition, the number of attachments listed is shown in the section header on the right.
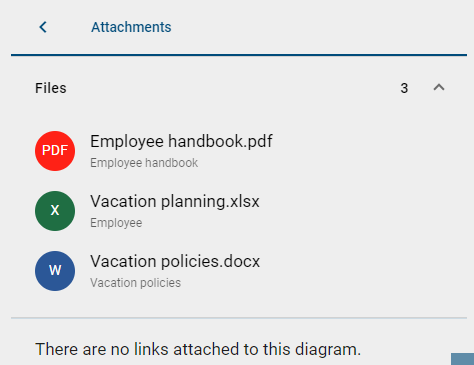
The Files list all files added to the diagram alphabetically, using the diagram or object attribute named Attachment (URL). For each list entry, you will see the title, if this has been assigned, or the name of the file instead. Below the title, the associated object in the diagram or the diagram itself, if the attachment is part of the diagram attributes, is named. For each entry you will also see a chip sorted alphabetically, which either displays the default file icon or highlights special file types, such as pdf and office files, for easier differentiation. With a click on a list entry you can download the corresponding file directly.
The Links list all URLs added to the diagram alphabetically via the diagram or object attribute named Attachment (URL). For each list entry, the title of the attachment, if this has been assigned, or the URL is displayed here. The URL is also displayed below. With a click on a list entry the URL is opened automatically.
Attachments can also be displayed or accessed via chips in the profile or in the matrix view.
Hint
Please note that the Attachment (URL) attribute can be restricted by an individual method configuration. In this case, it is only possible to store links or URLs, while other file types cannot be maintained.
How can I view the occurrences of symbols in checked in diagrams?
If you have opened a checked in diagram and want to display the occurrences of a symbol, proceed as follows.
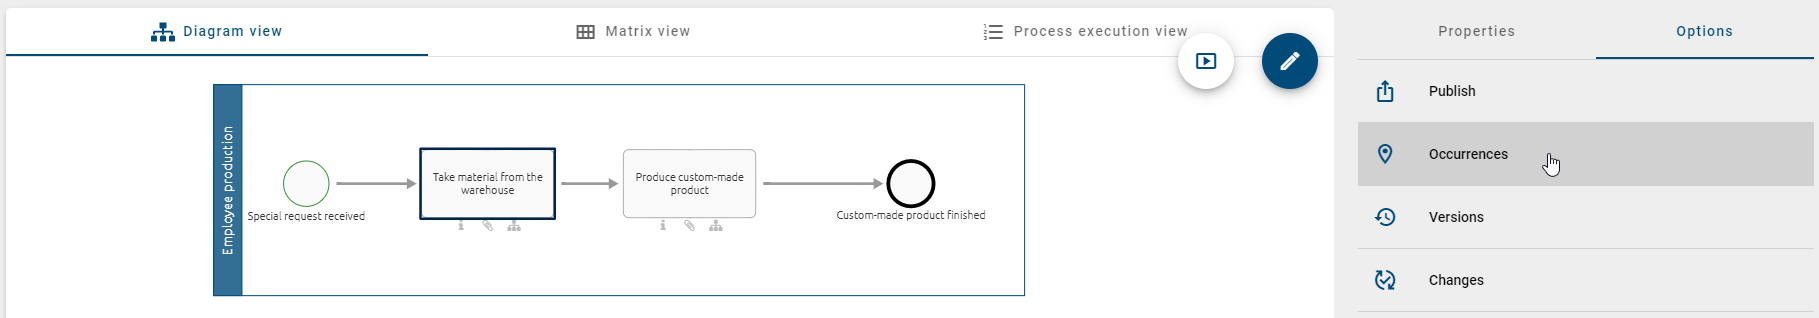
First select the desired symbol in the main area. Then, in the right sidebar, select the entry Occurrences.
A list will be displayed within the right sidebar, which contains an entry for every use of the given object.
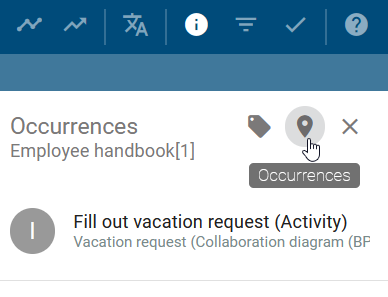
By clicking on a list entry, you can then navigate to another diagram in which the object is reused, or display the occurrences in the current diagram.
Note
If you have purchased and activated BIC EAM, context diagrams can also be referenced. Depending on whether the context diagram was created in the catalog or modeled, you will be redirected to the corresponding catalog or diagram view.
Tip
You can also access occurrences of symbols in checked out diagrams. You can find more information towards this here.
How can I get a full list of occurrences in the diagram options?
Panel for new occurrences
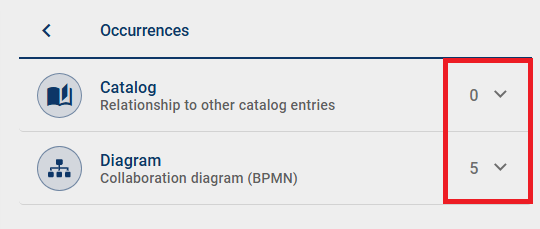
When you open the occurrences view of a diagram, a list of one or more panels appear displaying the connections of the selected entity to other catalog or diagram entities. Each list entry includes numbers representing the count of sub-entries.
Panel for occurrences in catalog items
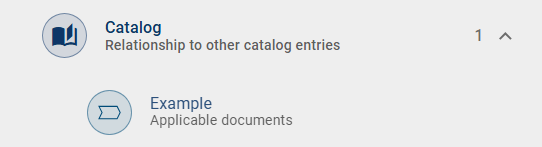
When the selected entity is assigned to another catalog entry, a sub-entry with the name of the respective catalog entry is displayed as the title. The subtitle contains the name of the associated attribute type, while the icon identifies the entity type.
Panel for occurrences in diagrams
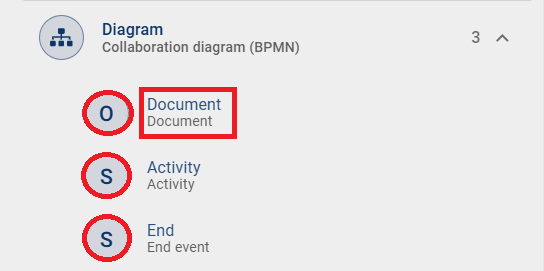
When the selected entity is used in another diagram as a diagram attribute, a subordinate list entry appears with the name of the relevant diagram as the title. The subtitle displays the associated attribute type name, and the icon represents the general diagram icon.
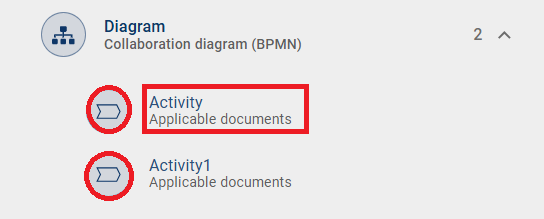
If the selected entity has an association with another entity in this diagram, a subordinate list entry appears with the name of the relevant entity as the title. The subtitle indicates the name of the associated entity type, and the icon displays an abbreviation of the association type.
If the selected entity is used in this diagram but has no association with another entity, a subordinate list entry appears with the entity’s name as the title. The icon displays a generic symbol to indicate that there is no association with another entity.
How can I highlight an object with a comment to indicate its position in the diagram?
When you open the comment panel of a diagram, and there is at least one comment for an object, you can view all comments made for that object under its name. In this context, you have the option to highlight the corresponding object with the selected comment directly in the diagram.
The object with the selected comment will then be highlighted in the diagram view.
Note
Please note that the selection of an object with its corresponding comment will be removed once you leave the comment panel, close the comment field of the selected object, choose another comment of an object, or the last comment of an object is deleted.
How can I track the changes in a diagram?
In the diagram view, you can display the changes in the diagram compared to its other versions. In the public workspace, this option gives you an insight on the changes that have been made in the diagram by the other modelers. If you view the changes of a diagram in preview or publication stage, you will notice what has been changed in the latest releases of the diagram.
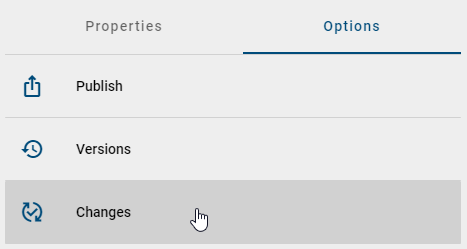
To view the changes, switch to the Options panel in the right sidebar and select the entry Changes. There exists no previous versions of the diagram, if this entry is deactivated.
For a detailed insight of changes in a diagram, you can go to the chapter Model comparison.
How can I adjust the resubmission interval for a diagram?
Users with at least the Author user role who are entered in the Author attribute of a diagram and work in the Public Workspace can adjust the resubmission interval of a diagram within a checked-out diagram using the Governance attribute group. To do this, open BIC Process Design and select the Diagrams menu item in the left menu bar. There you can either create a new diagram or check out an existing diagram.
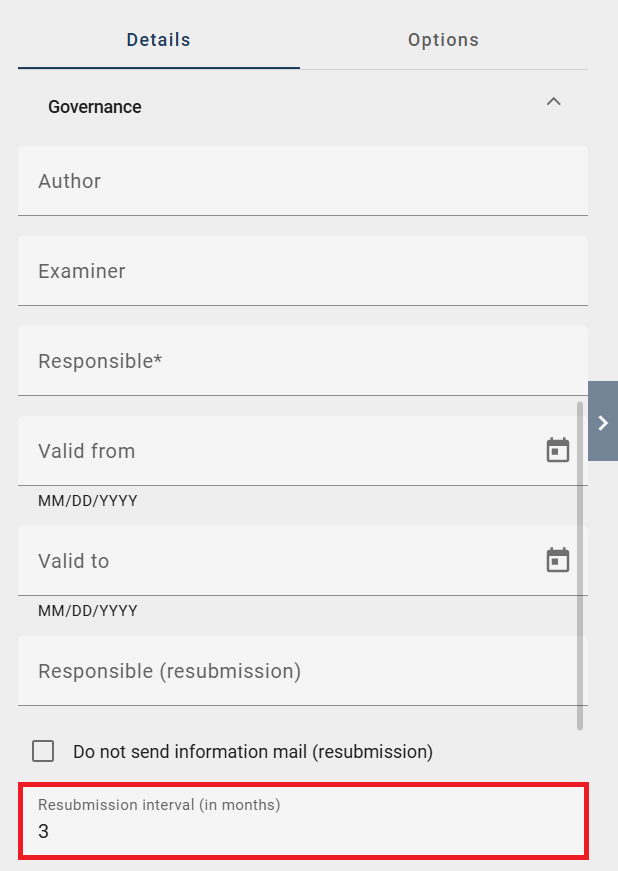
After creating a new diagram or opening an already existing one, check it out. Then navigate to the Details panel in the right sidebar and open the Governance attribute group. You will then have the option to assign a value to the Resubmission interval (in months) input field. This will override the default value set by the Administrator for this diagram. After the specified period has passed, the diagram will be rescheduled for review.
Warning
Please note that the Resubmission interval (in months) input field will only appear in your diagram if the method has been adjusted accordingly. To modify the method, you need access to the BIC Method Editor, which is a separately licensed module.
Hint
Assign a positive numerical value to the Resubmission interval (in months) input field so that the resubmission interval is applied correctly. Incorrect entries (e.g., 0, negative, or non-numeric values) prevent the check-in of the diagram and trigger an error message.
The change will be saved after you have saved and checked out your diagram.
How can I print the graphic of a diagram?
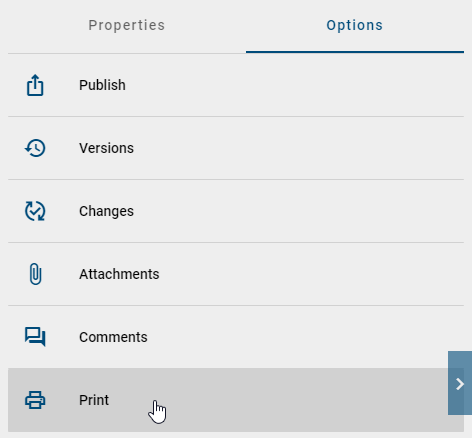
To print the graphic of a diagram, navigate to the Options and select the option Print.
In the preview, you will then see the print preview of the diagram with margins and the distribution of the graphic on the pages. The print preview also shows you the default settings, which you can adjust if necessary.
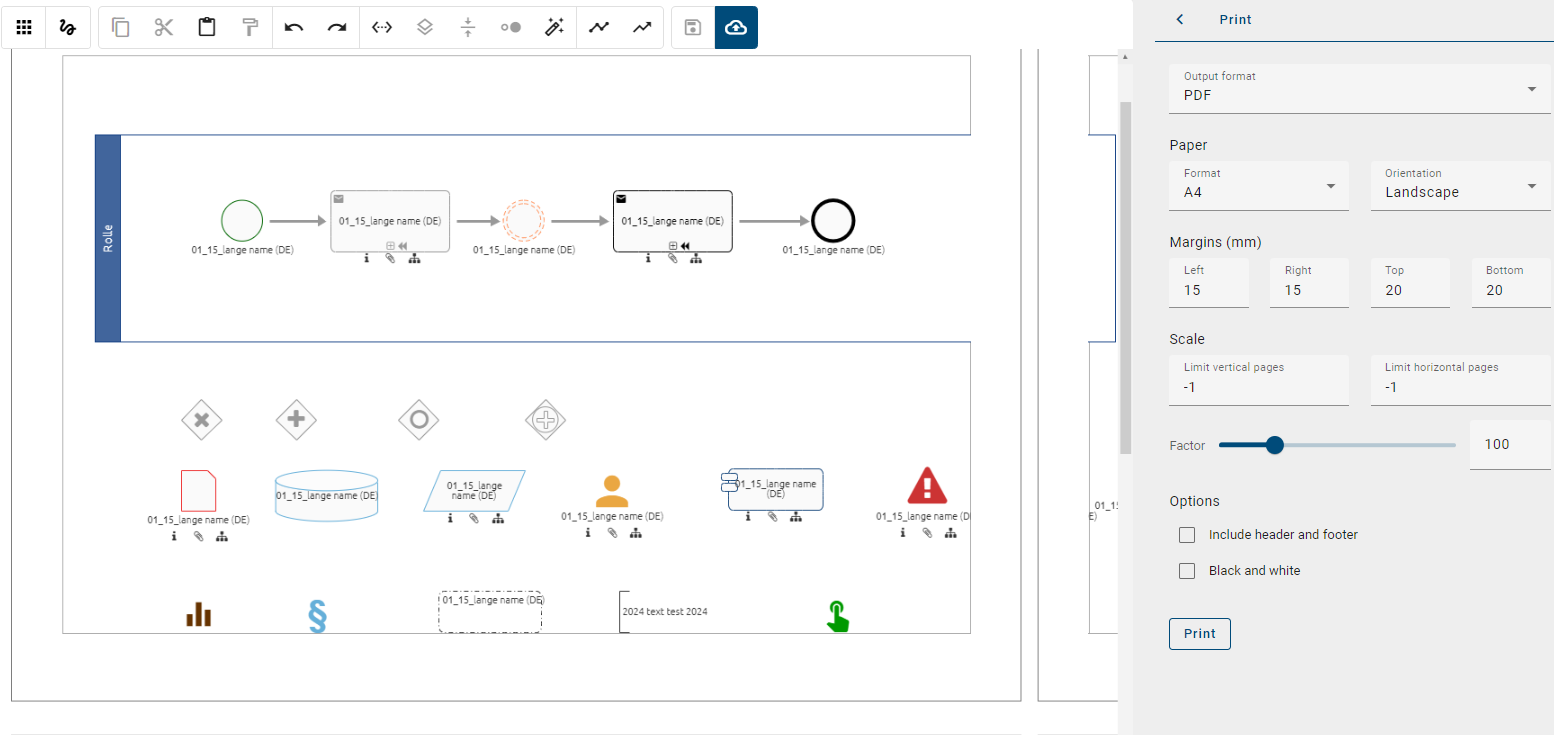
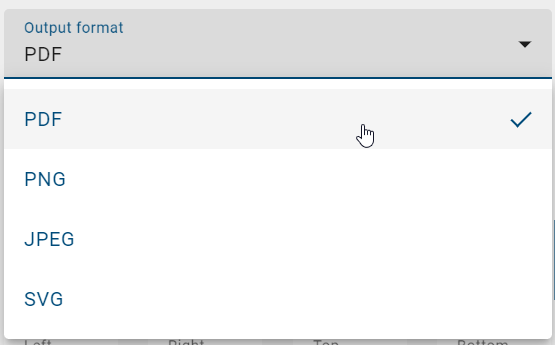
The choice of the output format is made through the drop-down menu, where you can set the preferred format for the graphic printing. You have the option to select from the formats PDF, PNG, JPEG, and SVG.
Note
Please note that SVG files do not support embedded fonts. The icons are based on the Material Icons and Font Awesome fonts and can only be displayed correctly if these fonts are installed on your host system. Otherwise, the missing icons will be displayed as rectangles, which is not a bug, but due to the SVG format. Our application includes all the necessary fonts to display SVG files correctly. However, if you need print output with embedded fonts, we recommend that you create a PDF file, as it contains all the necessary fonts for correct display.
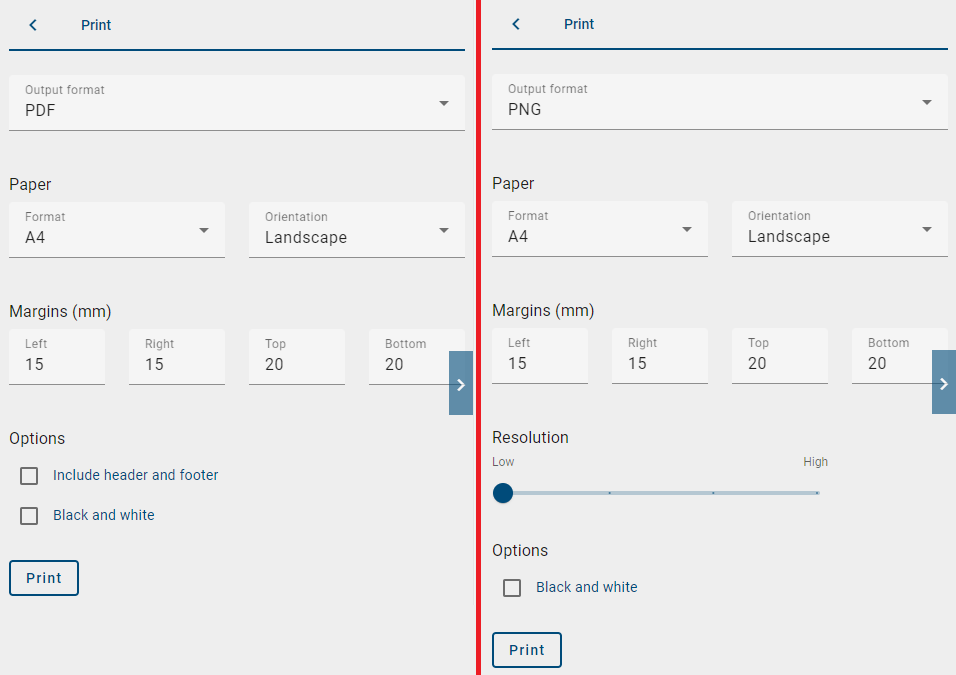
Furthermore, you can modify additional pre-settings in the print menu and customize the printing as desired:
Paper format (A0, A1, A2, A3, A4, A5, B3, B4, B5, LEGAL, LETTER)
Orientation (Landscape, Portrait, Automatic)
Margins (positive integers)
Resolution (only PNG and JPEG)
Include header and footer (only PDF)
Print in black and white
After configuring your print settings, click on Print and your graphic will be rendered. You will be notified with a message in the bottom right corner.
Once the rendering process is complete, a download link will be provided for you. Clicking on the link will initiate the download of a file with the diagram’s name in your current content language.
Tip
Please note that the print option is available for checked-in and checked-out diagrams.
Hint
Please note that texts in the supported languages Arabic, Chinese, Greek, Hindi, Japanese, Korean, Persian, Thai, and Vietnamese may not be displayed correctly in the printed PDF document. For Greek and Vietnamese text, the Roboto font is used, while for all other listed languages the Noto Sans font is displayed. Additionally, please note that Cyrillic text may not be accurately rendered in the fonts Handlee, Inconsolata, and Titillium Web and in such cases, it will be displayed in the Ubuntu font.
How can I hide symbol types in a diagram?
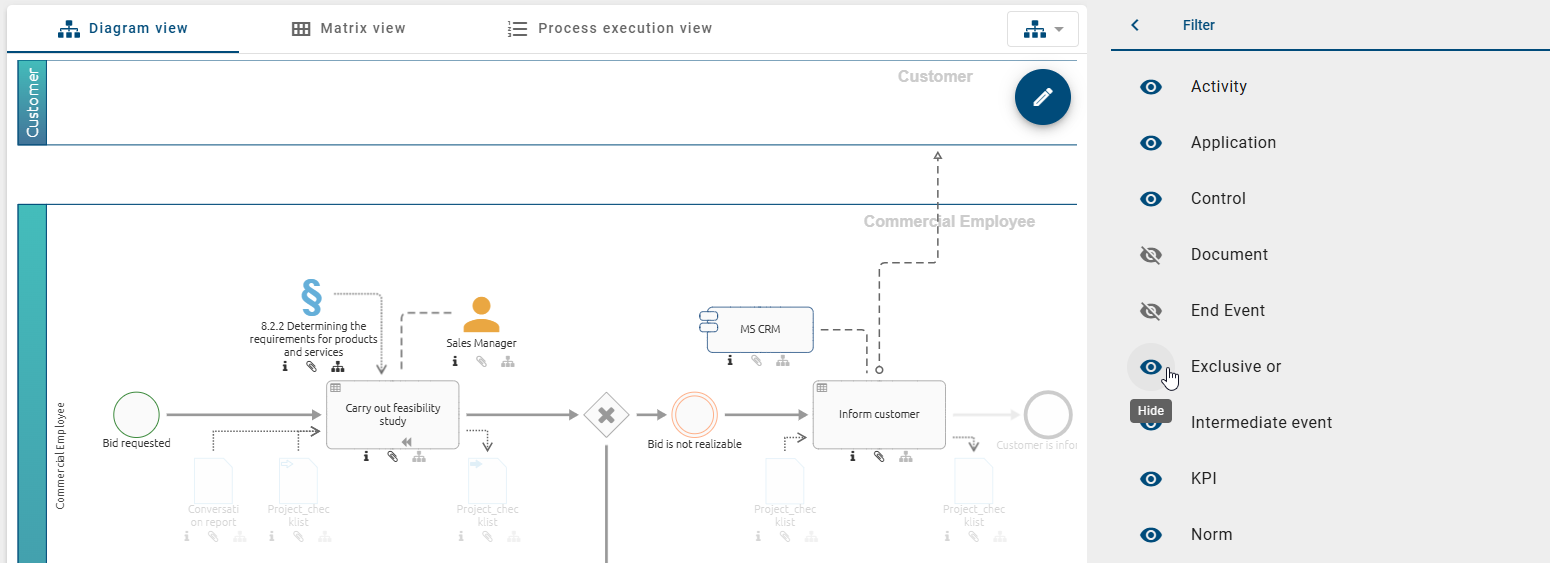
Every user has the option to hide modeled symbols, including their connections, in the diagram view. To do this, select the Diagrams menu item in the left menu bar and open a diagram to access the diagram view. Then switch to the Options panel in the right sidebar and click on the Filter option.
After clicking on the Filter option, all modeled symbol types in the diagram are listed in your browser language in alphabetical order. If you have modeled a pool, this symbol type cannot be hidden. To hide specific symbol types including their connections in the diagram, click on the Hide option, represented by an eye icon to the left of the symbol type name. Hidden symbol types are indicated by a crossed-out eye icon. This way, you can always keep track of which symbols are currently visible and which ones you have intentionally hidden.
If you want to make a previously hidden symbol visible again, click on the crossed-out eye icon. This will make all occurrences of that symbol in the diagram fully visible again. If you have hidden all symbol types, you can leave the Filter option to display all symbol types again.
Hint
Please note that your selection of hidden symbol types is not saved. As soon as you leave the Filter option or the diagram, all symbol types will be displayed again.
Translate diagrams
As an Administrator, Editor, or Author, you have the option of making diagrams and their objects and connections available in other languages and receiving translation suggestions for diagrams and their objects and connections. Translation mode is only available for users with the Author role for catalog suggestions if they are maintained in the Author governance attribute. Once a catalog suggestion has been accepted, it is no longer available in translation mode for users with the Author role.
How can I make diagrams and their objects and connections available in other languages?
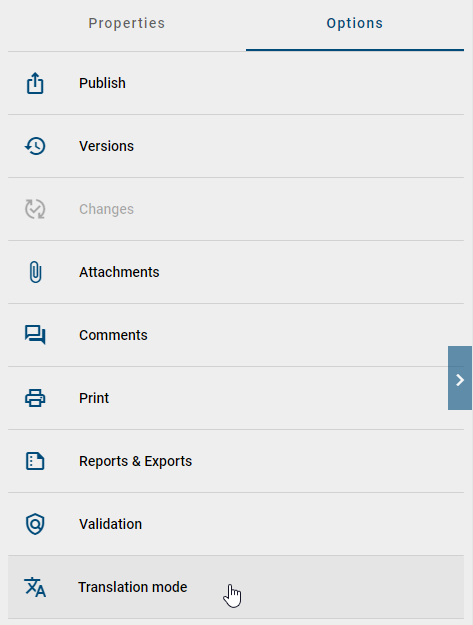
As an Administrator, Editor, or Author, you can translate diagrams, along with their objects and connections, into other languages supported by BIC. To do this, select the Diagrams menu item in the left menu bar and switch to the Public workspace stage if you are not already in this workspace. Then, select a diagram to open it in the diagram view. In the right sidebar, go to the Options panel and click on the Translation mode option.
Note
For users with the user role Author, the Translation mode option is only available if they are assigned as “Author” in the diagram’s governance attributes.
Note
If the selected diagram is locked by another user, the Translation mode option is not available.
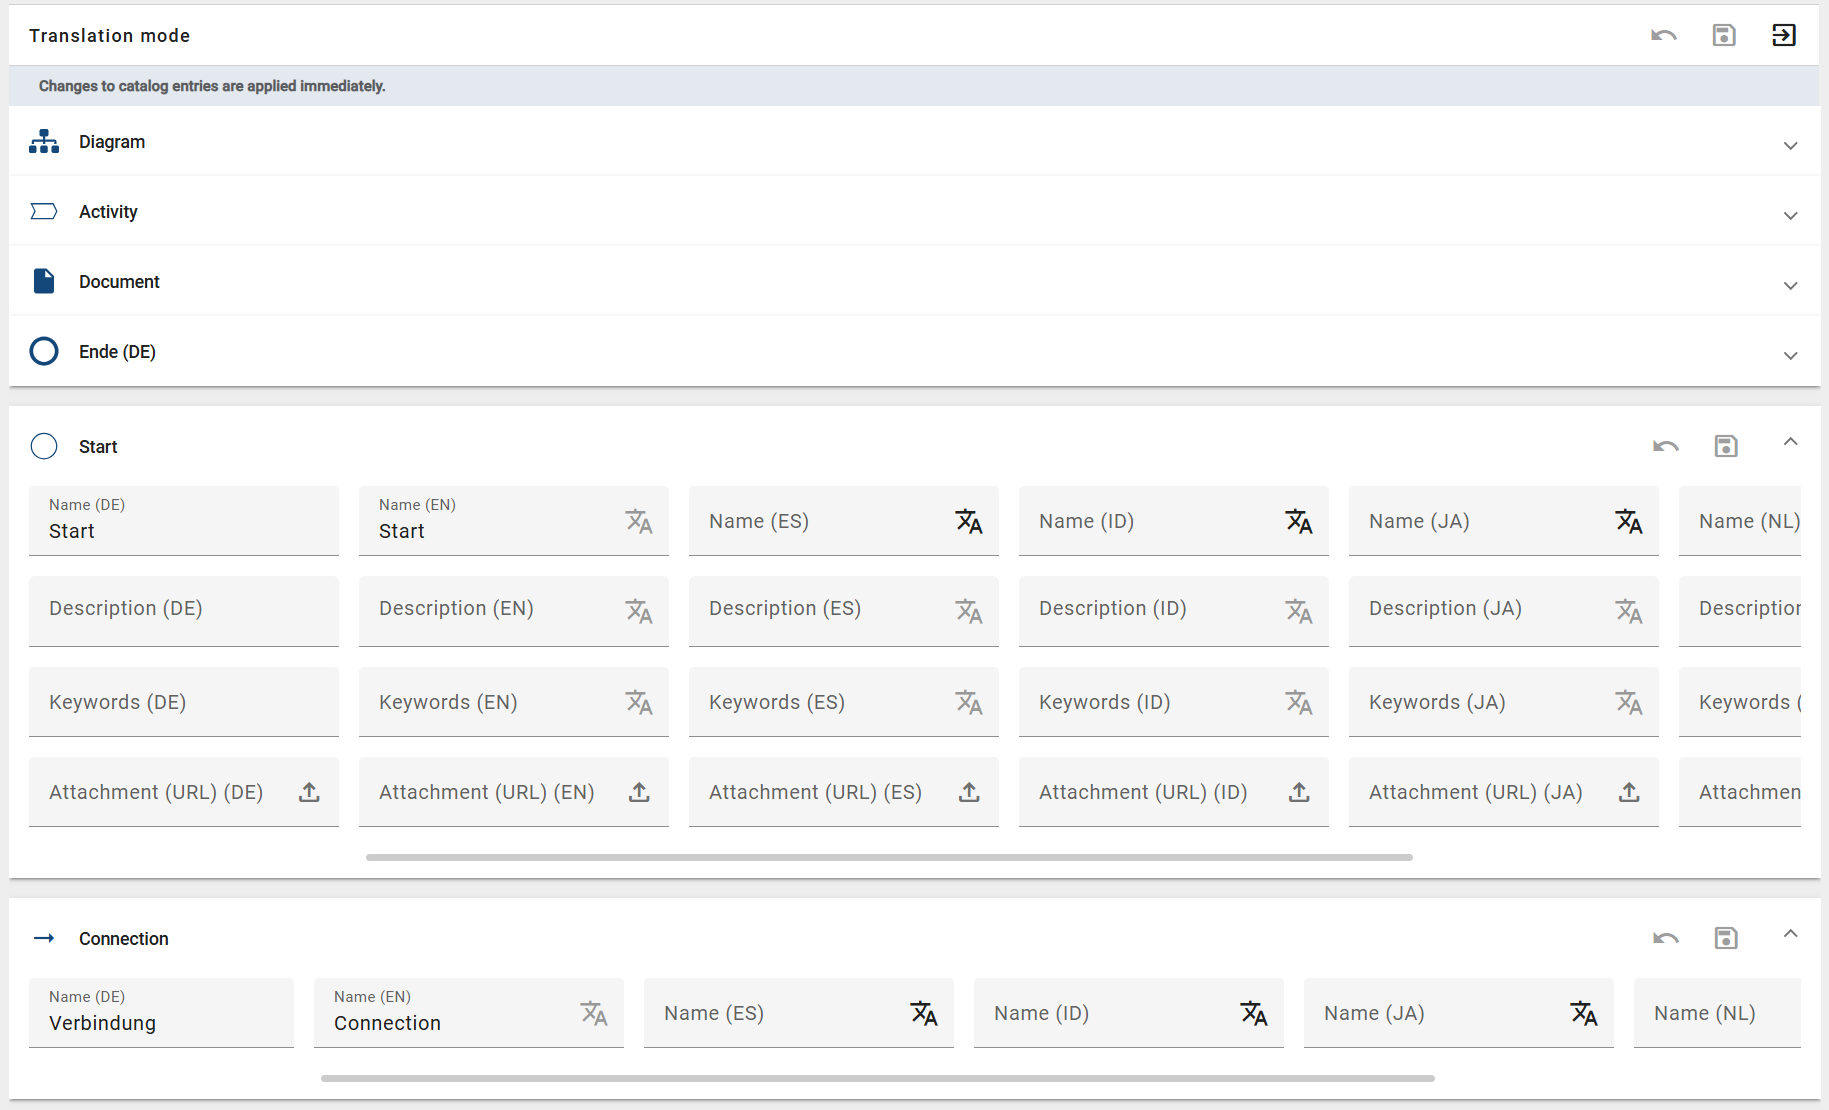
When you open the translation mode, a list appears showing the diagram along with all objects (activities, artifacts, events, gateways) and connections used in the diagram, displayed in your active content language. If the diagram, an object, or a connection has already been maintained in your alternative language, it will be shown in that language. By clicking on a specific list entry, you can translate the corresponding diagram, object, or connection into other supported languages.
You can translate the names, descriptions, keywords, and attachments (URLs) for both the diagram itself and the objects it contains. Translating the diagram itself helps to ensure that the diagram appears in the diagram list of the corresponding language. For connections, only the connection name can be translated.
Note
If an objects does not contain a name, but other language-dependent attributes are maintained, the object name defined in the method is displayed in the list view in your browser language.
Hint
Please note that if a connection does not have a name in any language, that connection will not be displayed in translation mode.
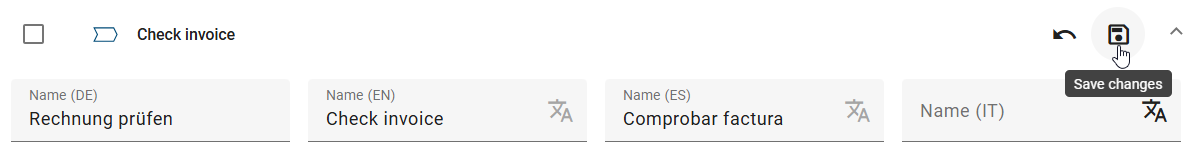
Once you have completed the translations, you can save the changes by clicking the middle Save changes button in the upper right corner of the translation mode. Any changes to the catalog items will also be applied. To discard your translations, click the left Discard changes button in the upper right corner of the translation mode.
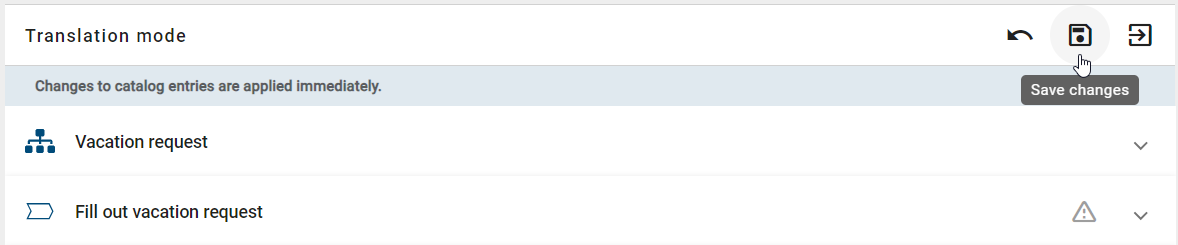
To exit the translation mode, click the Leave button in the upper right corner of the translation mode, or click on the Translation mode option in the Options panel in the right sidebar again. This will return you to the diagram view. If you attempt to exit translation mode with unsaved changes, you will be notified accordingly.
Tip
To avoid losing progress, we recommend using the Save changes option within each list entry when performing numerous translations.
Hint
Please note that the translation mode is only available for users with the Author role when working with catalog suggestions. Once a catalog suggestion has been accepted, it is no longer available in translation mode. Therefore, translations into other languages should be completed before the catalog object is accepted.
How can I get translation suggestions for diagrams and their objects and connections?
As an Administrator, Editor, or Author, you can get translation suggestions for diagrams, along with their objects and connections, into other languages supported by BIC. To do this, select the Diagrams menu item in the left menu bar and switch to the Public workspace stage if you are not already in this workspace. Then, select a diagram to open it in the diagram view. In the right sidebar, go to the Options panel and click on the Translation mode option.
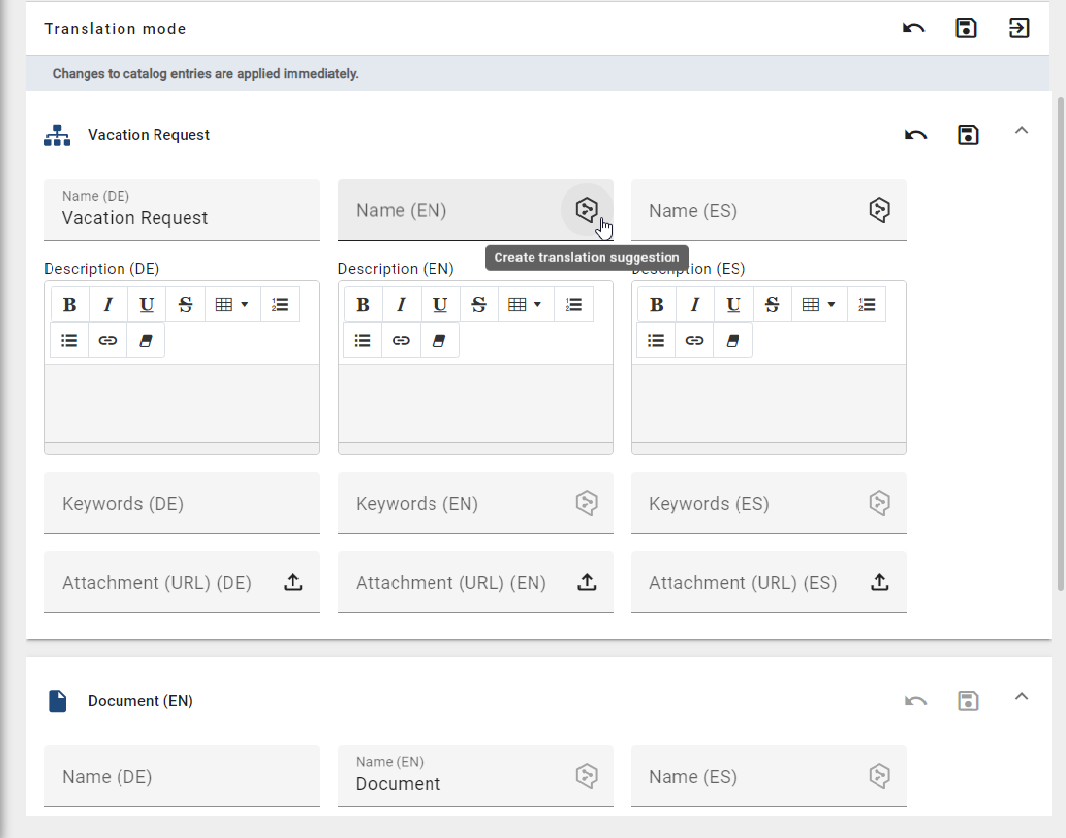
If the DeepL translation service is enabled for you, you can also generate translation suggestions for other languages for the attributes. All you need to do is maintain a language-dependent attribute in the active content language that serves as the basis for the translation suggestion.
To request a translation suggestion for a language-dependent attribute, select the Translate option in the corresponding input field. This will send a request to the DeepL API, which will automatically generate translation suggestions. If the input field already contains an input or the attribute is not maintained in the active content language, a translation suggestion cannot be generated.
How can I perform a bulk translation for diagram elements?
As a user with the Administrator, Editor, or Author user role, you can translate all translatable elements of a diagram at once. The prerequisite is that a translation service is connected. Translation mode is only available for users with the Author role for catalog suggestions if they are maintained in the Author governance attribute. Once a catalog suggestion has been accepted, it is no longer available in translation mode for users with the Author role.
To do this, open the Diagrams menu item in the left menu bar and select a diagram from the Public workspace stage. Switch to the Options panel in the right sidebar. Open the Translation mode option.
Note
If the selected diagram is locked by another user, the Translation mode option is not available to you.
After you have opened translation mode, a list is displayed. It contains the diagram as well as all objects (activities, artifacts, events, gateways) and connections in your active content language. When you have selected at least one element, you find a button for bulk translation in the header.
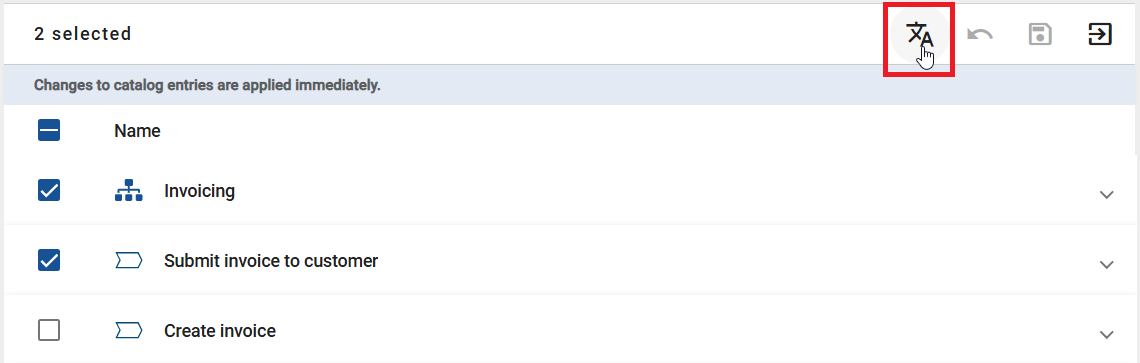
Start bulk translation
Click this button. A dialog then opens. Select the source language and the target language there.
In the Select attributes selection field, you can define the attribute types to be translated. The attribute types are sorted by attribute group. Select the desired attribute types via the checkboxes. The selected attribute types are displayed as chips in the selection field. Via the Select all checkbox, you can select or deselect all attribute types at once.
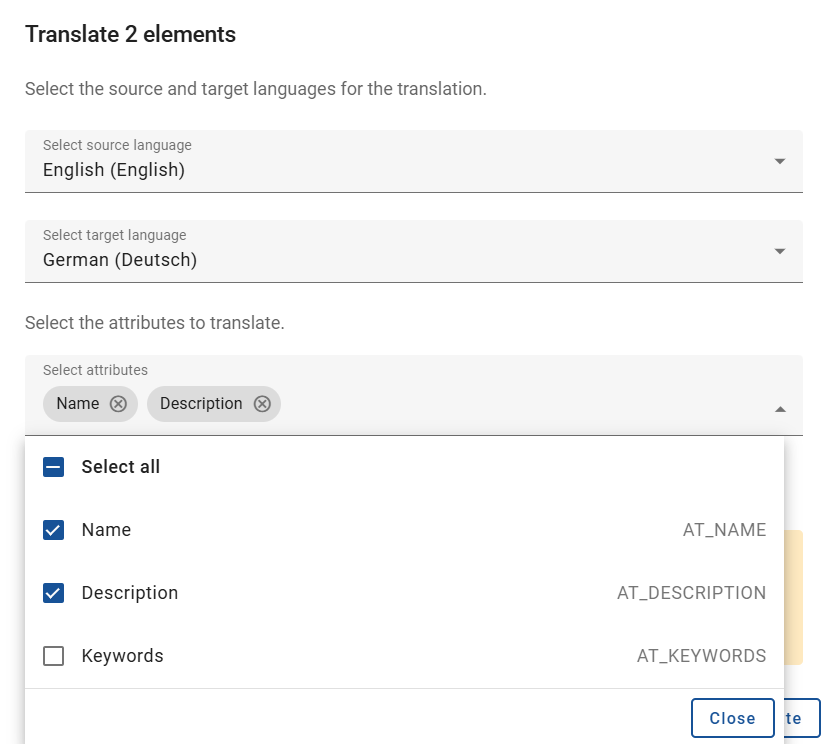
By default, existing values in the target language are not overwritten. If you want existing values to be overwritten, activate the Overwrite existing values in the target language checkbox.
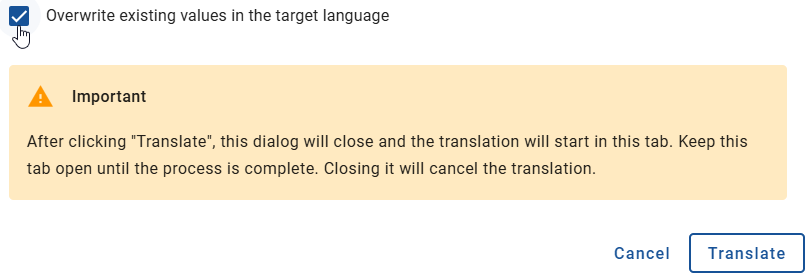
Then click the Translate button to start the translation. The Translate button is enabled as soon as at least one attribute type is selected. If no attribute type is selected, the Translate button remains deactivated. If you want to cancel the process, click the Cancel button.
Hint
If a language is not supported by the connected translation service, it is displayed as disabled in the dropdown list with the Not supported hint. Source and target language cannot be identical.
Perform bulk translation
After clicking the Translate button, the translation request is started. The list switches to a loading state. A banner informs you not to close the browser tab until the translation is completed.
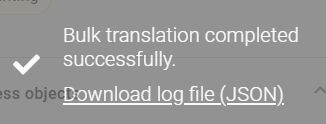
When the translation is completed, you receive feedback. This can have the following states:
All elements were translated.
Some elements could not be translated.
The translation failed.
If the bulk translation was successful, you can download a log file (JSON). It contains an overview of the translation results, the translated attribute types, and whether existing values were overwritten.
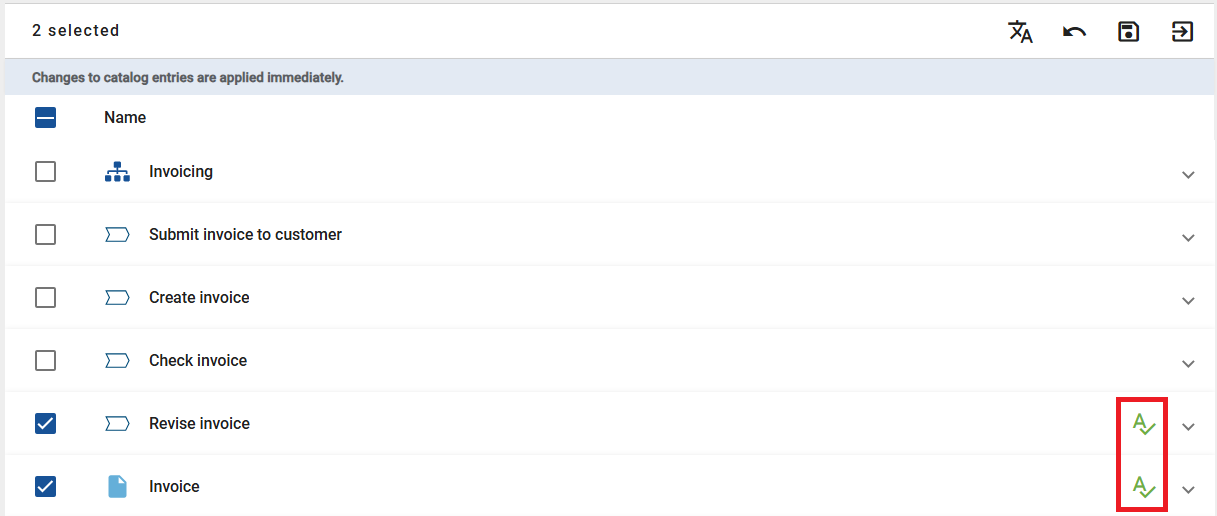
Successfully translated entries are automatically marked in the list after the bulk translation. This way you can see at a glance which entries have been translated.
The success indicator is automatically removed in the following cases:
You save or discard changes for a single list entry or for all list entries.
You start a new bulk translation request.
You leave translation mode.
Hint
If you manually change an attribute value, no success indicator is displayed.
View bulk translation values
You can view the translated values by expanding a list entry. There you see all translated attribute values. Missing values are displayed as empty.
If you have made changes to the translated values, you can save them via the Save changes button. Via the Discard changes button, you can discard the changes and restore the original values. Both buttons are available for individual list entries as well as for all list entries at once.
Hint
After the translation is completed, the element selection is retained. You can adjust the selection afterwards. When you leave translation mode, the selection is cleared.
To exit translation mode, click the Leave button in the upper right corner or click the Translation mode option again in the Options panel in the right sidebar. You are then redirected to the diagram view. If you have unsaved changes, a corresponding notification appears.
Note
While a translation request is running or the diagram is open in translation mode, the diagram is locked for other users. It cannot be checked out during this time. The diagram is only released again when you leave translation mode.
Note
Only one target language can be selected per translation request. Another translation request can only be started when the current one is completed.