Reports and Exports
In the right sidebar of a diagram, you can find the Reports & Exports option in the Options panel. With this option, you can export diagrams and their content in different formats and continue to use them. This includes, for example, the Excel Export and the Diagram Export. You can also create reports, for example standard reports and custom reports. Which exports and reports are available to you depends on your user role.
In addition, this chapter also describes the Excel exports of categories and the imports of archives and BPMN diagrams. You also have the option to export the image of a diagram in different file formats. You can find more information about this here.
Hint
Please note that the Reports & Exports option is not available if you want to create an Excel export from the public workspace for a locked diagram.
What export options are available?
The following exports are available to you depending on your user role:
Excel Export (available for all user roles)
Diagram Export (available for Administrators and, for Editors, only the diagram archive)
Reports (available for all user roles)
Process Cost/Simulation (available for all user roles)
Excel Exports
What Excel export options are available?
Every user can create an Excel export with the content of a diagram. Users with the Administrator, Editor, or Author user role can also create an export from the public workspace. For the diagram types VCD, EPC, and BPMN, the Matrix Report is additionally available by default. The exports can be configured and enabled or disabled in the Administration by the Administrator.
Process Matrix: The Process Matrix (.xlsx file) can be created by default for VCD, EPC, and BPMN diagrams. You can use it for a category or for the whole repository. The export file contains seven worksheets. The first five worksheets show ready-made evaluations of different objects. These include:
Application usage
Document usage
RACI mapping
Risk occurrences
Diagram metrics
These evaluations are created automatically using pivot tables.
The Data worksheet contains all collected information. This includes:
Diagram information
all activities
directly connected objects (satellites)
The Entity ID and the Occurrence ID are also shown. These clearly identify an object and its occurrence in the diagram. Objects that are not connected or only indirectly connected are not included. This applies, for example, to controls of risks. The report also does not include information about the process flow.
The last worksheet Matrix contains a pivot table. You can find more information about pivot tables here or on the related support website.
Best Practice
With the Process Matrix, you can quickly see which satellites are connected to which activities. For example, if an application is discontinued, you can immediately see which diagrams, activities, and other elements are affected. Use the fields of the pivot table and the filter functions in Excel. You can also answer additional questions using the column fields and value fields of the pivot table.
Process Warehouse: You can create this export as an .xlsx file for different categories and diagrams. If you run the export for a category, all included diagrams are considered. The exported Excel file contains the Diagram and Object worksheets.
In the Diagram worksheet, you can see:
all attributes of the diagrams
the diagram ID
the name of the parent category
In the Object worksheet, you can see:
the object type
the symbol type
all attributes of the objects in the diagrams
The Entity ID and the Occurrence ID are also shown. These identify an object and its occurrence in the diagram clearly. You can also see for each object which diagram it belongs to (diagram name and diagram ID).
The attributes are exported in the currently selected content language. Applied filters are also considered during export. This means only filtered objects are exported.
Tip
As part of GDPR measures, you can filter the Process Warehouse by documents and activities with the attribute “Data Protection”. You can also filter by “Risk” to see the risk matrix.
Hint
Please note that system values, for example names of symbol or object types and column headers, are shown in the language of your browser. Content you maintain yourself, such as diagram or activity names or text-based attribute values, is shown in the currently selected content language. Because of this, system terms (browser-dependent) and your own content may appear in different languages in the Warehouse and Matrix Report.
Hint
In older versions, all attribute types were exported, even if they were disabled or removed in the method. Now only visible attribute types are exported.
Hint
Please note that an error message is shown in Excel exports if the data type of an attribute does not match the current method definition. The export is still created completely and can be downloaded. However, the content in those places may be incorrect.
Hint
Please note that a Matrix Report created from a diagram without sequence flows or message flows (that means only activities, events, or gateways without connections) results in an empty Excel file. When you open the file and choose “Enable Editing”, a warning message is shown. This is expected behavior, because the pivot table in the Matrix Report shows relationships between diagram elements. Without sequence or message flows, no relationships are defined.
Note
Attribute values that contain more than 32767 characters are automatically shortened. You will receive a note at the end of the shortened value that it has been shortened.
Note
You can also create Excel Exports of Categories to export data from multiple diagrams into one file. Excel exports can also be created for archived versions.
How can I export the contents of a diagram as an Excel file?
Every user can export the content of a diagram as an Excel file. For this, the two exports Warehouse Report and Matrix Report are available. More information can be found here.
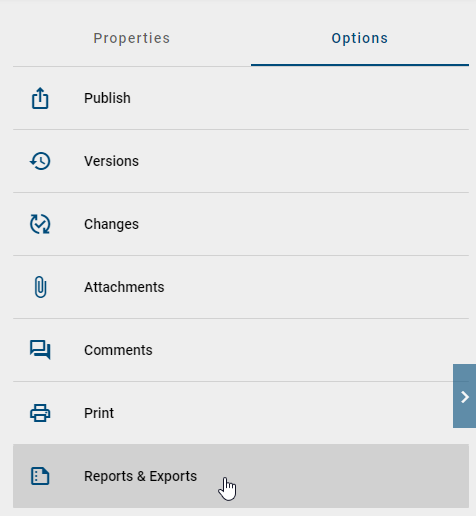
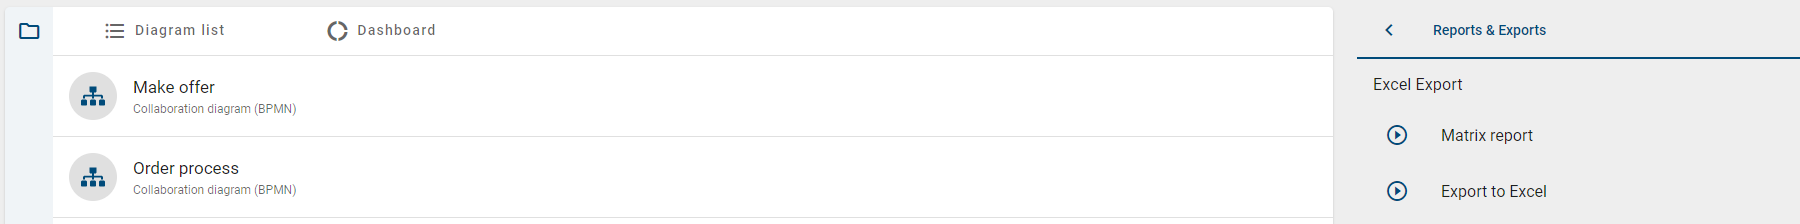
To create an Excel export, open the Diagrams menu item in the left menu bar and select a diagram. Then switch to the Options panel in the right sidebar and select the Reports & Exports option.
Hint
Please note that the Reports & Exports option is not available if you want to create an Excel export from the public workspace for a locked diagram.
After you have clicked on the Reports & Exports option, you see two or three sections depending on your user role. In the first section, you find the Excel exports.
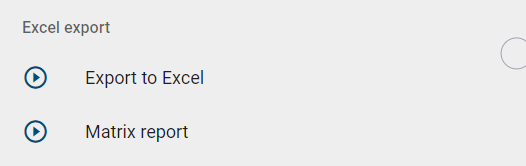
To create an Excel export, click on the name of the export. The corresponding export is then created and you receive a message. When the export is finished, a second message with a link appears. Click on the link to download the Excel file.
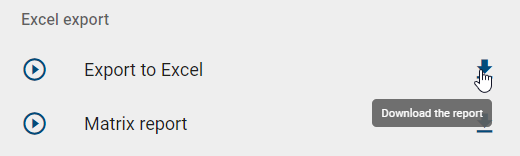
After the first creation of the export, a download button is displayed to the right of the name of the corresponding export. This way you can download the file again at any time. The Excel export is created only for you. Other users must create the Excel export themselves.
If the download button is no longer shown, the diagram has been changed after the export. In this case, you need to create the Excel export again. The export always contains the current data of the diagram.
Hint
Please note that system values, for example names of symbol or object types and column headers, are shown in the language of your browser. Content you maintain yourself, such as diagram or activity names or text-based attribute values, is shown in the currently selected content language. Because of this, system terms (browser-dependent) and your own content may appear in different languages in the Warehouse and Matrix Report.
Tip
As part of GDPR measures, you can filter the Process Warehouse by documents and activities where “Data Protection” is set. You can also filter by “Risk” to display the risk matrix.
Tip
You can also start an export directly from a filtered diagram list. In this case, the Excel file contains only the currently displayed diagrams. The applied filters define which information is included in the “Diagram” and “Object” worksheets. If no matching diagrams are found, the Excel file remains empty.
Note
Attributes with date values are also saved as dates in the Excel export. This allows you to continue using the values, for example to calculate time periods. This applies to all Process Warehouse exports, whether they are created for Repositories, Categories, Diagrams, or the Catalog. The date format in Excel (for example 12.05.2019 or 12/05/2019) depends on the language settings in Windows.
Hint
Please note that an error message is shown in Excel exports if the data type of an attribute does not match the current method definition. The export is still created completely and can be downloaded. However, the content in those places may be incorrect.
Note
You can also create Excel Exports of Categories to export data from multiple diagrams into one file. Excel exports can also be created for archived versions.
How can I export all diagrams as an Excel file?
Every user can export a diagram category or all diagrams of a repository as an Excel file. For this, the two exports Warehouse Report and Matrix Report are available. More information can be found here.
If you want to create an Excel export, open the Diagrams menu item in the left menu bar. If you want to export all diagrams, switch to the Options panel in the right sidebar and select the Reports & Exports option. If you only want to export a specific category, first select a category in the category explorer. Then also switch to the Options panel in the right sidebar and select the Reports & Exports option.
To create an Excel export, click on the name of the export. The corresponding export is then created and you receive a message. When the export is finished, a second message with a link appears. Click on the link to download the Excel file.
After the first export is created, a download button appears to the right of the export name. This allows you to download the file again at any time. The Excel export is created only for you. Other users must create the Excel export themselves.

If the download button is no longer shown, at least one diagram has been changed after the export. In this case, you need to create the Excel export again. The export always contains the current data of the diagrams.
Best Practice
With the Matrix Report, you can quickly see which satellites are connected to which activities. For example, if an application is discontinued, you can immediately see which diagrams, activities, and other elements are affected. Use the fields of the pivot table and the filter functions in Excel. You can also answer additional questions using the column fields and value fields of the pivot table.
Note
Date values in the export, for example “Valid from”, “Valid to”, or “Created on”, are converted to the time zone of the current user. This ensures that all data is shown according to the user’s time zone.
Note
You can also create Excel Exports for individual diagrams.
Hint
Please note that a Matrix Report can be empty if a diagram does not contain sequence or message flows. In this case, Excel shows a warning message when opening the file. This is correct, because the pivot table only shows relationships between elements. Without connections, there are no relationships.
Reports
Which reports can I download?
Every user can see the available reports. If you open the Diagrams menu item in the left menu bar and select a diagram, you find the Reports & Exports option in the Options panel in the right sidebar. In the Reports section, all users can see the standard reports of BIC Process Design as well as custom reports.
Custom reports can be configured and enabled or disabled in the Administration by the Administrator. In addition, you can customize the reports with report templates.
The following standard reports are available:
Manual: The Manual report (.docx document) can be created by default for individual diagrams (BPMN and EPC). The cover page contains the name of the diagram and important approval data. The report includes:
a process overview
a process diagram
an overview of responsibilities
a table of process steps
an appendix
The process overview shows, by default, executing and participating roles, inputs, outputs, IT systems, as well as risks and KPIs. The table of process steps contains a list of all activities and the related objects, such as inputs, outputs, systems, risks, and KPIs.
Manual with details: This report can be created for process overviews (VCD) and processes (EPC and BPMN) if details are available. It includes a detailed description of the process and all linked diagrams.
Note
Subprocesses for start or end activities with the node symbol type NST_INTERFACE are not included in the Manual with details.
Process Cost/Simulation: This report is created as an .xlsx file for individual diagrams (BPMN and EPC). It shows costs, times, and capacity needs of a process based on the data stored in the diagram.
The Excel file contains several worksheets with information about:
activities
resources
costs and times
A detailed explanation of Process Cost/Simulation can be found here.
Hint
Please note that the Reports & Exports option is not available if you want to create a report from the public workspace for a locked diagram.
How can I create and download a report?
Every user can create and download a report. The report is always based on the current version of the diagram. Therefore, depending on your user role, make sure which stage you are in and switch it if needed.
To create a report, open the Diagrams menu item in the left menu bar and open a diagram. Then switch to the Options panel in the right sidebar and select the Reports & Exports option.
After you have clicked on the Reports & Exports option, you see two or three sections depending on your user role. In the second section, you find all available reports. To create a report, click on the name of the report.
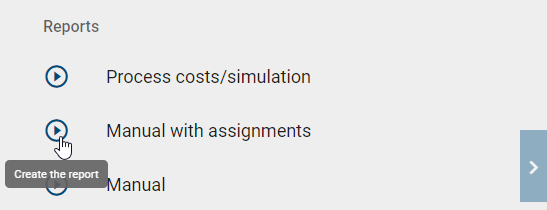
The corresponding report is then created and you receive a message. When the report is finished, a second message with a link appears. Click on the link to download the report.
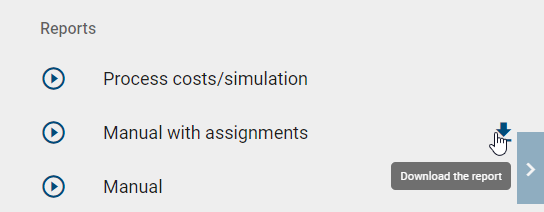
After the first creation, a download button is displayed to the right of the name of the corresponding report. This way you can download the report again at any time. The report is created only for you. Other users must create the report themselves.
If an error message is shown in a report instead of a value, the data type does not match the current method definition. The report is still created and can be downloaded. However, the content in those places may be incorrect. To fix this issue, contact your Administrator or GBTEC Support.
Note
The language of the reports depends on the selected content language.
Note
You can also create reports from opened, archived versions.
Which reports sort activities by process flow?
In certain reports, activities are sorted according to the process flow of the corresponding diagram. This means that activities at the beginning of the process are also listed first in the report. This behavior corresponds to the matrix view in the diagram. There, activities are also displayed along the process flow.
Sorting by process flow applies to all reports in DOCX format. These include:
Manual
Manual with assignments
The following diagram types are supported:
Collaboration diagram (BPMN)
Process (EPC)
Process overviews (VCD) are not supported.
Behavior with Gateways and Operators
If gateways or operators are used:
The order of the subsequent activities is determined based on their probability
The probability must be maintained as an attribute on the outgoing activities
If no probabilities are maintained, the order may deviate from the expected process logic.
Diagram exports
Which diagram exports are available?
Users with the Administrator or Editor user role can download the diagram archive of any diagram. Users with the Administrator user role can also download a BPMN file of an individual diagram.
Diagram archive: This export creates a .zip file for a single diagram. The archive contains all important information of the diagram. You can use it for backup or to transfer it to another system. The export always matches the current state of the selected area.
BPMN file: This export creates a BPMN file for a single diagram. You can transfer the file to other systems or continue working with it there. The export always matches the current state of the selected stage.
How can I export a diagram?
You can export diagrams to save data or to transfer it to another system. Users with the Administrator user role can download both exports (diagram archive and BPMN file). Users with the Editor user role can only download the diagram archive. The export works in the public workspace, preview, and publication. You find the function in the Options panel of a diagram or via the context menu in the diagram list.
If you open the Diagrams menu item in the left menu bar and select a diagram, switch to the Options panel in the right sidebar and select the Reports & Exports option there.
Hint
Please note that the Reports & Exports option is not available if you want to create a report from the public workspace for a locked diagram.
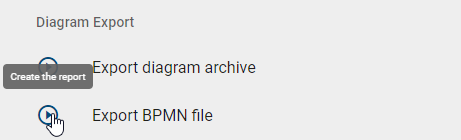
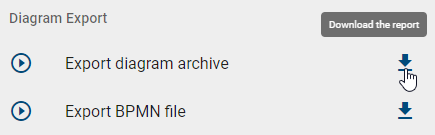
After you have clicked on the Reports & Exports option, you see three sections. In the third section, you find the diagram exports. To start an export, click on the name of the desired export.
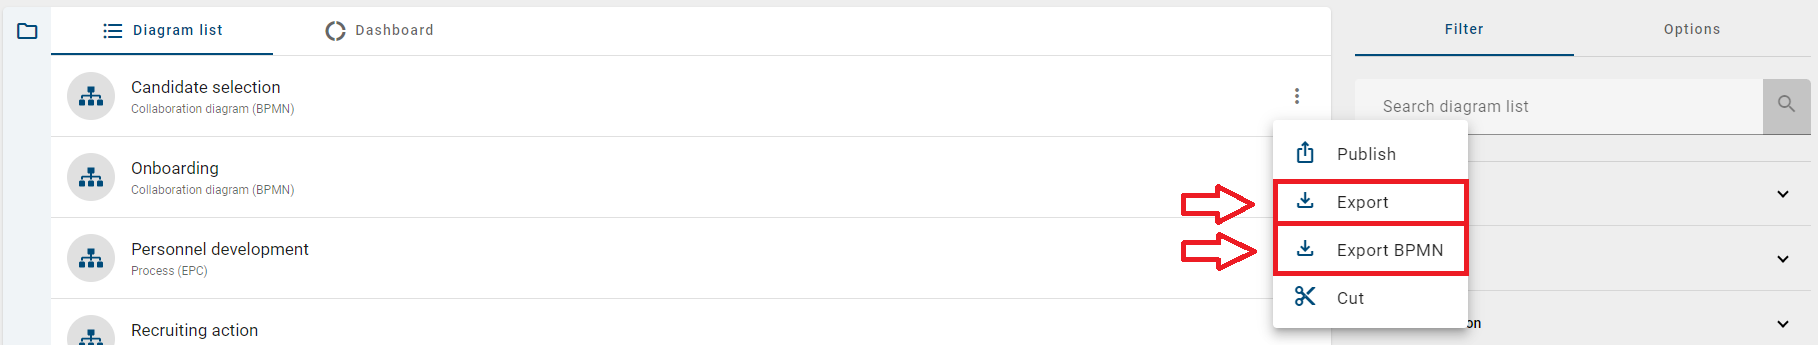
Alternatively, you can also start the export directly from the diagram list in the Diagrams menu item. To do this, open the context menu of a diagram. Select the Export option or the Export BPMN option there.
The export is created and you receive a message. As soon as the export is finished, a second message with a download link appears. Click on the link to download the file.
The diagram archive is downloaded as a .zip file.
The BPMN file is downloaded as a .bpmn file.
After the first creation, a download button appears to the right of the export name. This allows you to download the export again at any time. The export is created only for you. Other users must create the export themselves.
If the download button is no longer shown, the diagram has been changed after the export. In this case, you need to create the diagram export again. The export always contains the current data of the diagram.
Warning
BIC can extend the BPMN notation, for example for Customer Journey Mapping. If such extensions are used, exporting the BPMN file may not be possible.
Note
Date values in the export, for example “Valid from”, “Valid to”, or “Created on”, are converted to the time zone of the current user. This ensures that all data is shown according to the user’s time zone.
Note
Attribute values longer than 32767 characters are automatically shortened. A note is added at the end of the text.
Note
In older versions, all attribute types were exported, even if they were disabled or removed. Now only visible attribute types are exported.
How can I import an archive or diagram?
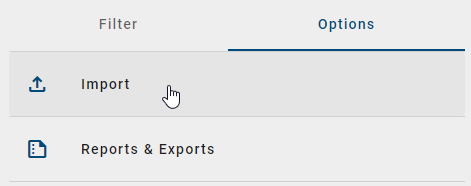
Users with the Administrator or Editor user role can import an exported archive or a BPMN diagram into the current repository. To do this, open the Diagrams menu item in the left menu bar. Then switch to the Options panel in the right sidebar. Click on the Import option there.
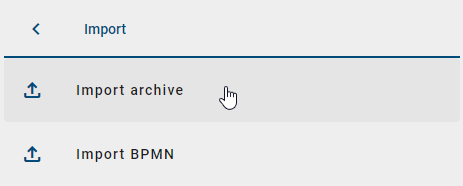
After you have clicked on the Import option, you can choose whether you want to import an archive or a BPMN diagram.
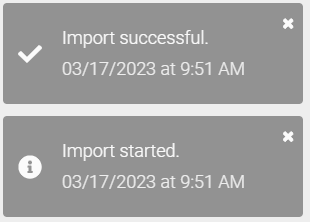
A file selection window then opens. Select the desired file. The import starts automatically. You can recognize this by a message on the right side of the screen. If the import was successful, you receive another message.
Note
The maximum size for imports is 1,000 MB.
Note
Date values in the import, for example “Valid from”, “Valid to”, or “Created on”, are converted to the time zone of the current user. This ensures that all data is shown according to the user’s time zone.
If the imported archive already exists in the repository, the following happens:
Diagrams with the same diagram ID are archived. The imported diagram becomes the active version.
Diagrams with the same diagram ID in a category are removed and imported into the selected category.
Categories with the same category ID remain unchanged.
Objects (entities) with the same entity ID are updated.
Note
A diagram with the same diagram ID can only exist once in the repository.
Process Cost/Simulation
Every user can create a Process Cost/Simulation (.xlsx file) for individual diagrams. To create a Process Cost/Simulation, open the Diagrams menu item in the left menu bar and select a diagram. Then switch to the Options panel in the right sidebar and select the Reports & Exports option.
In the Reports section, you can create the Process Cost/Simulation for individual diagrams (BPMN and EPC). The Process Cost/Simulation can be configured and enabled or disabled in the Administration by the Administrator. The download of the report is described here.
The report shows an overview and calculations for costs, times, and capacity needs on three worksheets. For a useful evaluation, some attribute inputs are required in the relevant diagrams in BIC Process Design. These inputs concern the names of resources and activities as well as the attributes in the Analysis attribute group. The values are automatically transferred to the report. If needed, you can also adjust the values manually in the report.
If a resource object appears multiple times in a diagram, it is summarized as one object in the report. Activities or resources with the same name, however, are shown separately. Different objects should have different names. This way the calculations remain correct. The individual worksheets explain the values and calculations so that the procedure is clear to you.
“Activities” worksheet
The Activities worksheet contains four different sections. The following text explains the functions and calculations based on the individual terms in the sections.
Process costs: This section is important for all further calculations of times and costs. These calculations are performed automatically. Only the Currency cell is filled in automatically. You must fill in the other cells yourself in the Excel file.
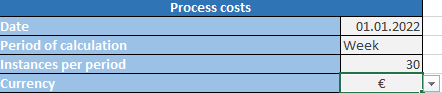
Date: In this cell, you can enter any date, for example the current date.
Period of calculation: In this cell, you enter the calculation period, for example “week” or “month”. Make sure that the calculation period matches the inputs in BIC Process Design. Otherwise, some calculations may be distorted. The capacity of a resource (see “Resources” worksheet), for example, depends on the calculation period.
Instances per period: In this cell, you enter the number of instances of this process per period, for example 5. Only with this number can further calculations be performed automatically.
Currency: The Currency cell shows the currency symbol for Euro (”€”) by default. This symbol is used on all worksheets. You can change the currency to Dollar (“$”). To do this, click on the cell and open the drop-down list. The change is automatically applied to all worksheets.
Activities of the process: This section shows a summary of the process activities, their frequencies, and the total costs. Some values in this section are only calculated through the following calculations.
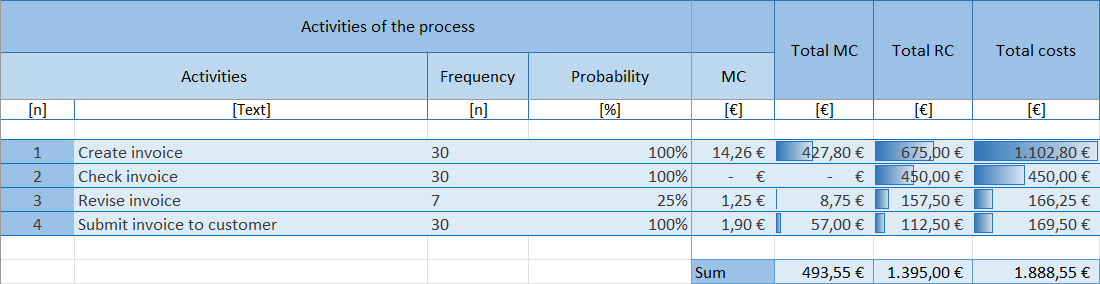
The following values are taken from the system:
Activities: Number assigned when the process is read, and name of the activity
Probability: Probability with which this activity is performed in the process (in %)
Material costs (MC): Cost of an activity (in €)
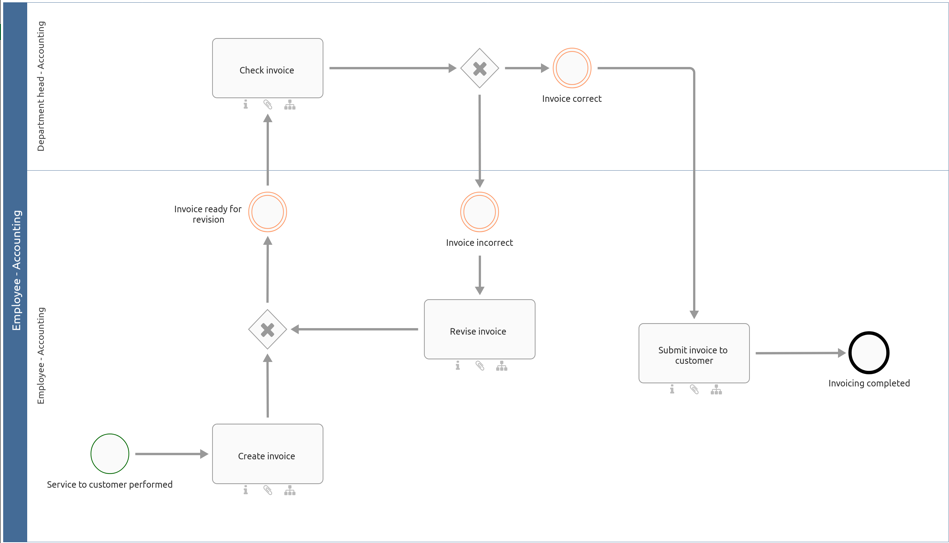
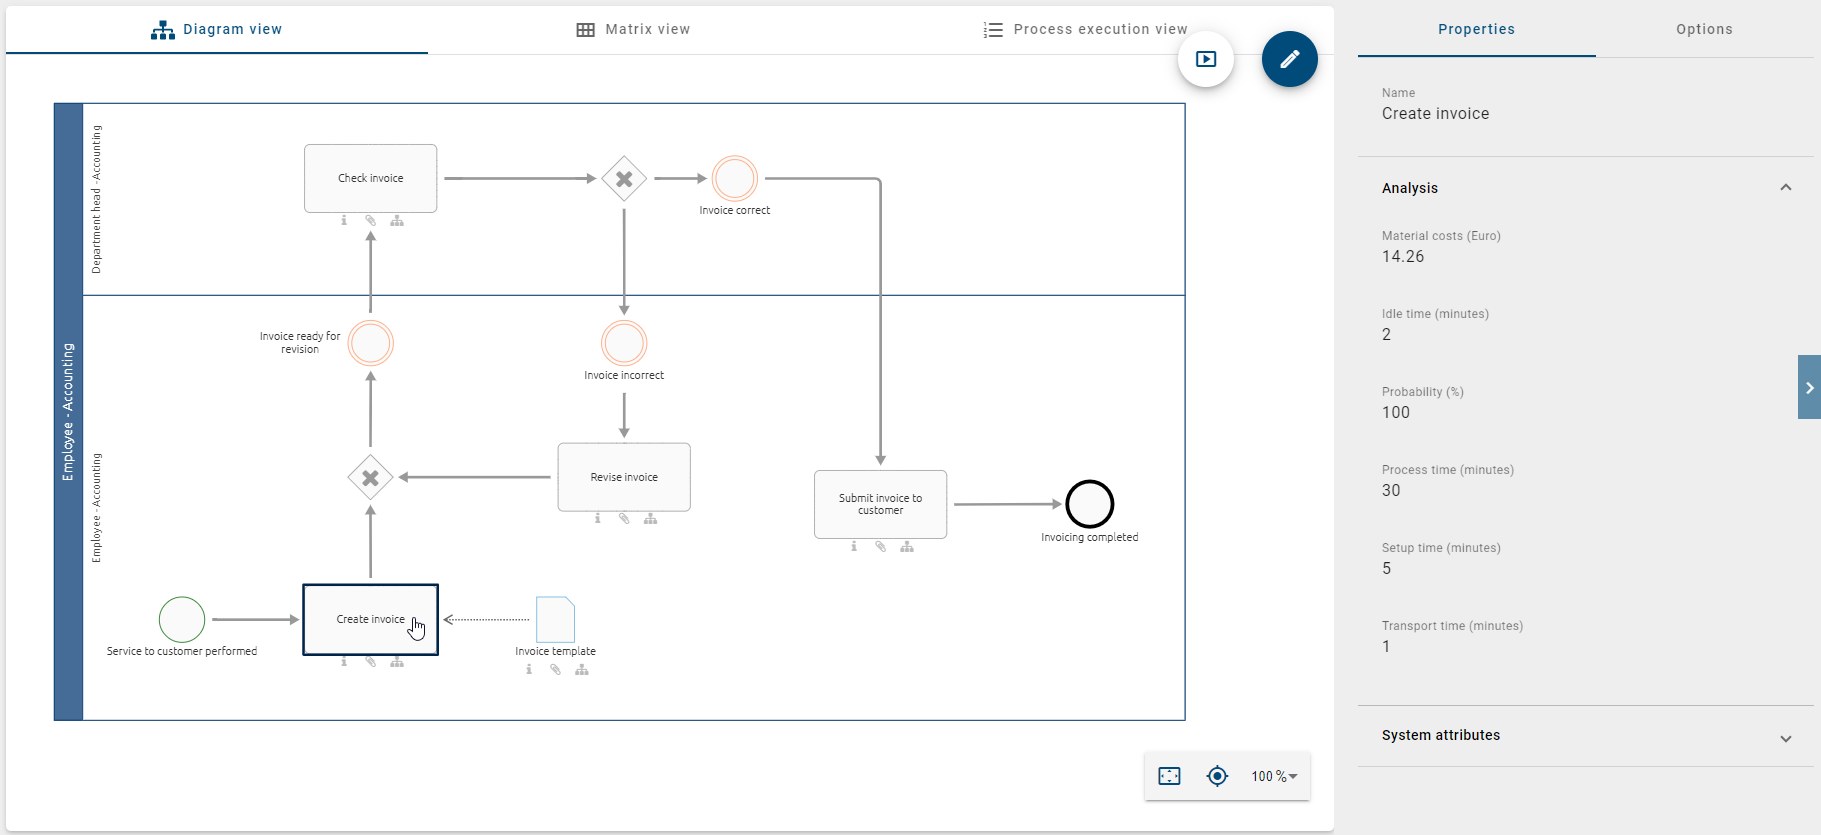
For example, the values for the “Create invoice” activity have been entered in the attributes in the system as follows:
The following calculations are performed in the report depending on the number of instances:
Frequency: Probability multiplied by the number of instances. This value shows how often an activity is executed per period.
Total material costs (Total MC): Material costs multiplied by the frequency. This value corresponds to the material costs of an activity per period (in €).
Total resource costs (Total RC): Sum of all costs of the resources involved in this activity per period (in €). The calculation is done using the Resources section.
Total costs: Sum of total resource costs and total material costs per activity per period (in €).
Sum: These three numbers represent the summed Total MC, Total RC, and Total costs of all activities. They correspond to the total costs of the period (in €).
Times: This section lists basic times and outputs total times.
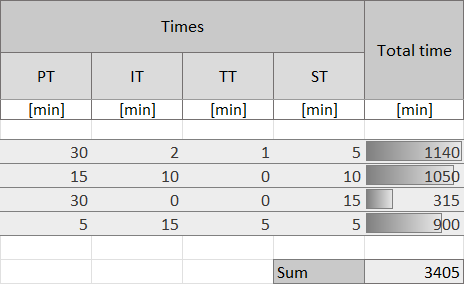
The following values are taken from the system:
Process time (PT): Processing time of an activity (in minutes)
Idle time (IT): Idle time of an activity (in minutes)
Transport time (TT): Transport time of an activity (in minutes)
Setup time (ST): Setup time of an activity (in minutes)
For example, the values for “Activity 1” have been entered in the attributes in the system as follows:
The following calculations are performed in the report depending on the number of instances:
Total time: Sum of all times (process time, idle time, transport time, and setup time) multiplied by the frequency per activity (in minutes)
Sum: Sum of the total times of all activities per period (in minutes)
Resources: This section consists of several resource blocks that are shown one after another. Each resource block is four columns wide. For each resource, the name and values such as costs and times are shown. If a resource is involved in an activity, numbers are shown in the respective row. The cells remain empty if a resource does not execute the activity. The calculation for Total RC is done across all resources together and is shown in the last column of the section. The listed resources come from the Resources worksheet. The worksheets are linked and influence each other.
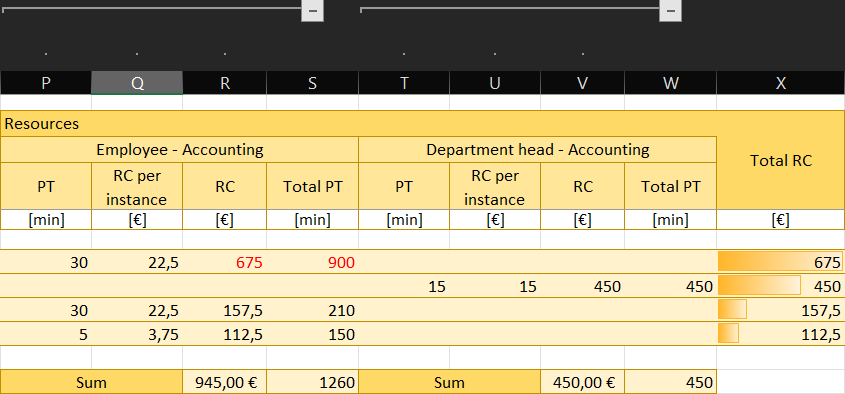
The following value is taken from the system:
Process time (PT): Time a resource needs to process an activity (in minutes). This value corresponds to the process time of the activity if no separate entry per resource is possible in BIC Process Design. You can change the value manually in the report.
The following calculations are performed in the report depending on the number of instances:
Resource costs per instance (RC per instance): Cost rate of the resource (see Resources worksheet) multiplied by the process time of the resource for the activity (in €). This value shows how much a resource costs per instance.
Resource costs (RC): Resource costs per instance multiplied by the frequency (in €). This value shows the costs of the resource for the activity per period.
Total process time (Total PT): Frequency multiplied by the process time of the resource for the activity (in minutes). This value shows how much time the resource needs per period.
Sum: Sum of the resource costs and process time. This value shows the total costs and the total time of the resource per activity per period (in € or in minutes).
Total resource costs (Total RC): Sum of all resource costs per activity. This value shows the costs of an activity per period, caused by all involved resources (in €).
Note
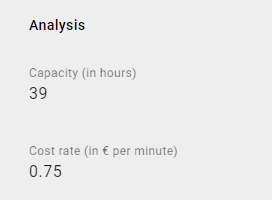
You can change the values taken from the system in the report afterwards. This concerns, for example, names, probabilities, costs, times, and capacities. Changes are useful, for example, for the analysis root attributes Capacity and Cost rate of the Role object if these values are activity-specific. In contrast to occurrence attributes, root attributes are adopted for each occurrence of an object. Therefore, you should only change confirmed objects in the catalog or directly in the file.
“Resources” worksheet
The Resources worksheet shows the resource requirement calculation. It displays the capacities and costs of individual resources separately.
Capacity requirements calculation: This section lists some values of the resources separately. These values come from the inputs in the system, from the calculations in the Activities worksheet, or are calculated separately here.
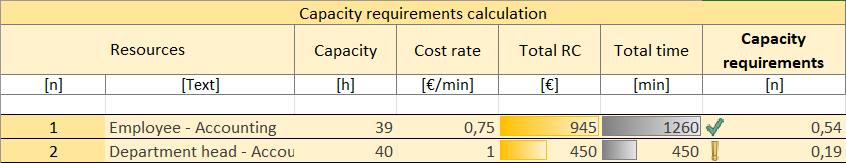
The following values are taken from the system:
Resources: Number assigned when the process is read, and name of the resource
Capacity: Capacity of the resource (in hours)
Cost rate: Cost rate of the resource (in € per minute)
For example, the values for the “Employee - Accounting” role have been entered in the attributes in the system as follows:
The following calculations are performed in the report depending on the number of instances:
Total resource costs (Total RC): Sum of the costs of this resource in the selected period (in €). This value is taken from the “Activities” worksheet, Resources section, Sum row.
Total time: Sum of the processing times of the resource across the participating activities in the selected period (in minutes). This value is taken from the “Activities” worksheet, Resources section, Sum row.
Capacity requirements: Ratio of the total time the resource needs to perform the activities of this process to its available capacity. The value shows how much the resource uses its available time or whether it needs more time for its tasks. The following distinction is made:
Value greater than 1 (red X): The time required for the tasks exceeds the capacity of the resource for the process. There is an additional capacity requirement.
Value between 0.5 and 1 (green check mark): The capacity is equal to or half as large as the required processing time of the activities. The resource has sufficient capacity.
Value less than 0.5 (yellow exclamation mark): The capacity is more than twice as large as the required processing time of the activities. The resource has a lot of free capacity.
“Diagram” worksheet
The Diagram worksheet shows an image of the evaluated diagram.