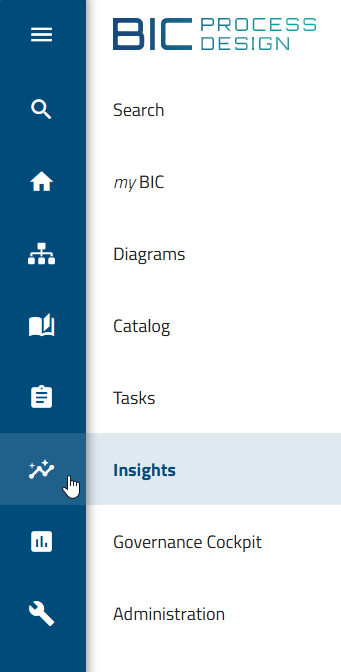
Insights
To use the Insights functionality, the Enterprise Architecture Management (EAM) must be purchased and activated for the user. BIC Enterprise Architecture Management is a separate module and license.
Enterprise Architecture Management (EAM) supports companies answer key questions about the IT landscape, such as the application landscape, cost distribution or the criticality of providers. A proven way of presenting such analyses is a matrix-like view, which we refer to as Insights. This allows you to visually display dependencies between different objects and highlight relevant metrics in color.
Initially, we offer predefined Insights that are specifically tailored to certain EAM-related issues. In the future, we plan to further expand the context and use of these insights and provide additional analytical views.
Where can I find the Insights?
Once BIC EAM has been purchased and activated, all users will be able to access Insights through the Insights menu item in the left menu bar.
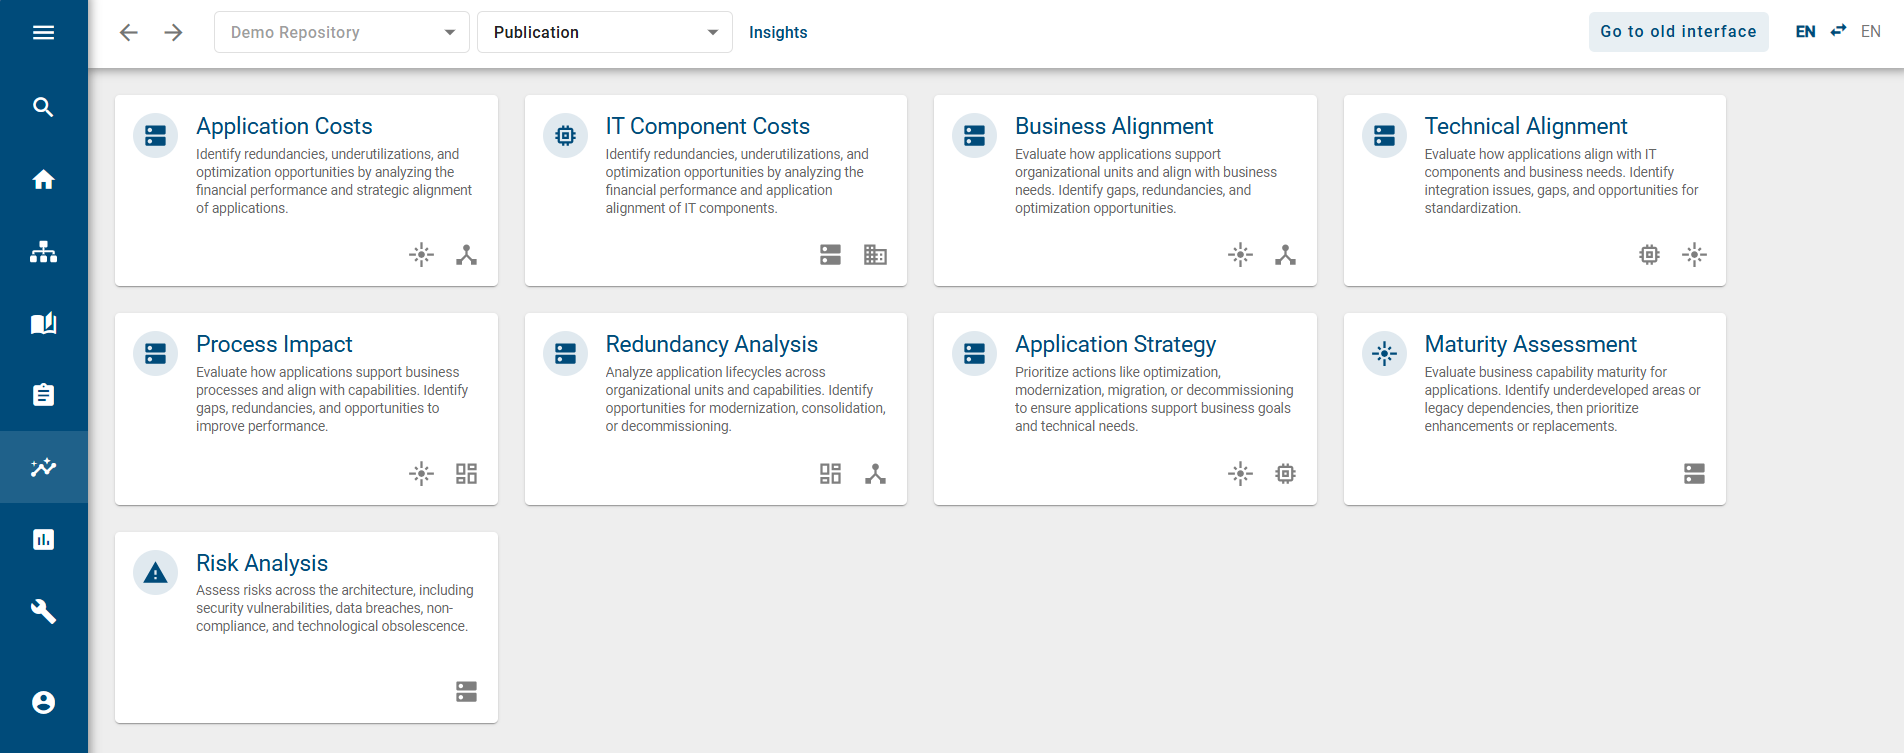
After selecting the menu item, a collection of Insight tiles will be displayed. Each of these tiles provides technical notes on typical EAM-related questions.
How are the Insights displayed?
Once BIC EAM has been purchased and activated, all users will be able to access Insights through the Insights menu item in the left menu bar. Here you will see a collection of predefined tiles. Selecting and opening a tile will display the relevant information.
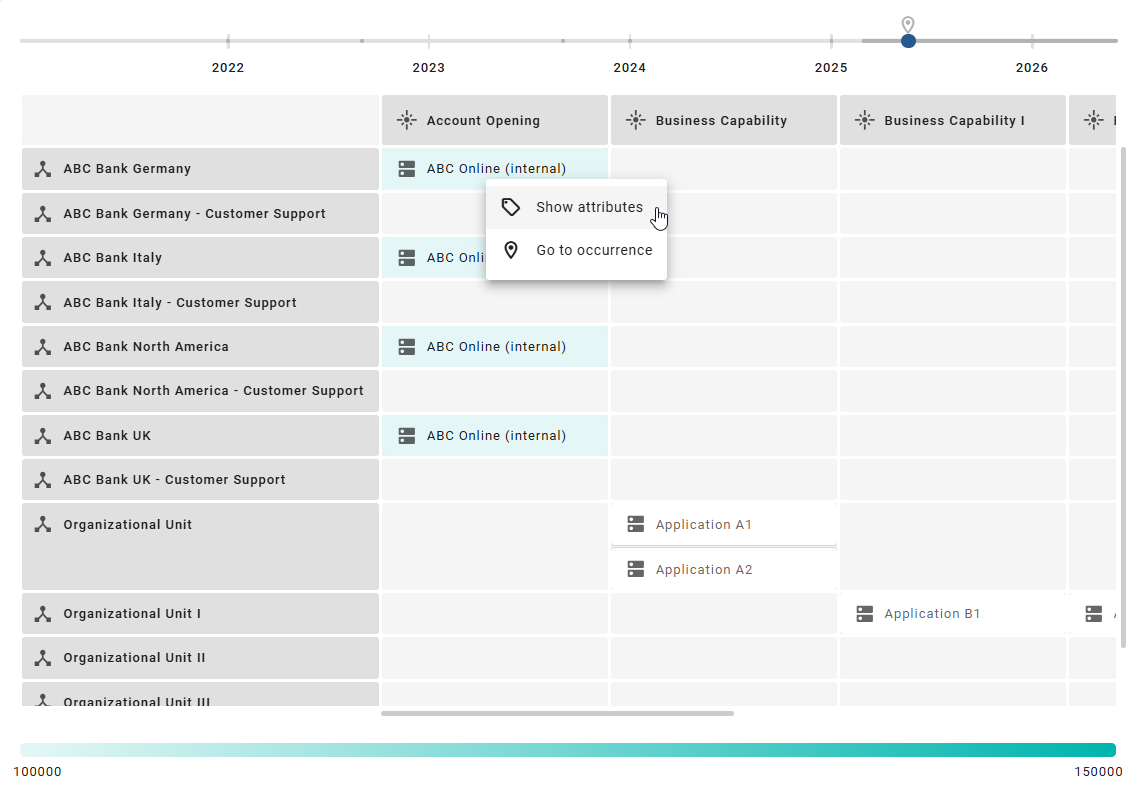
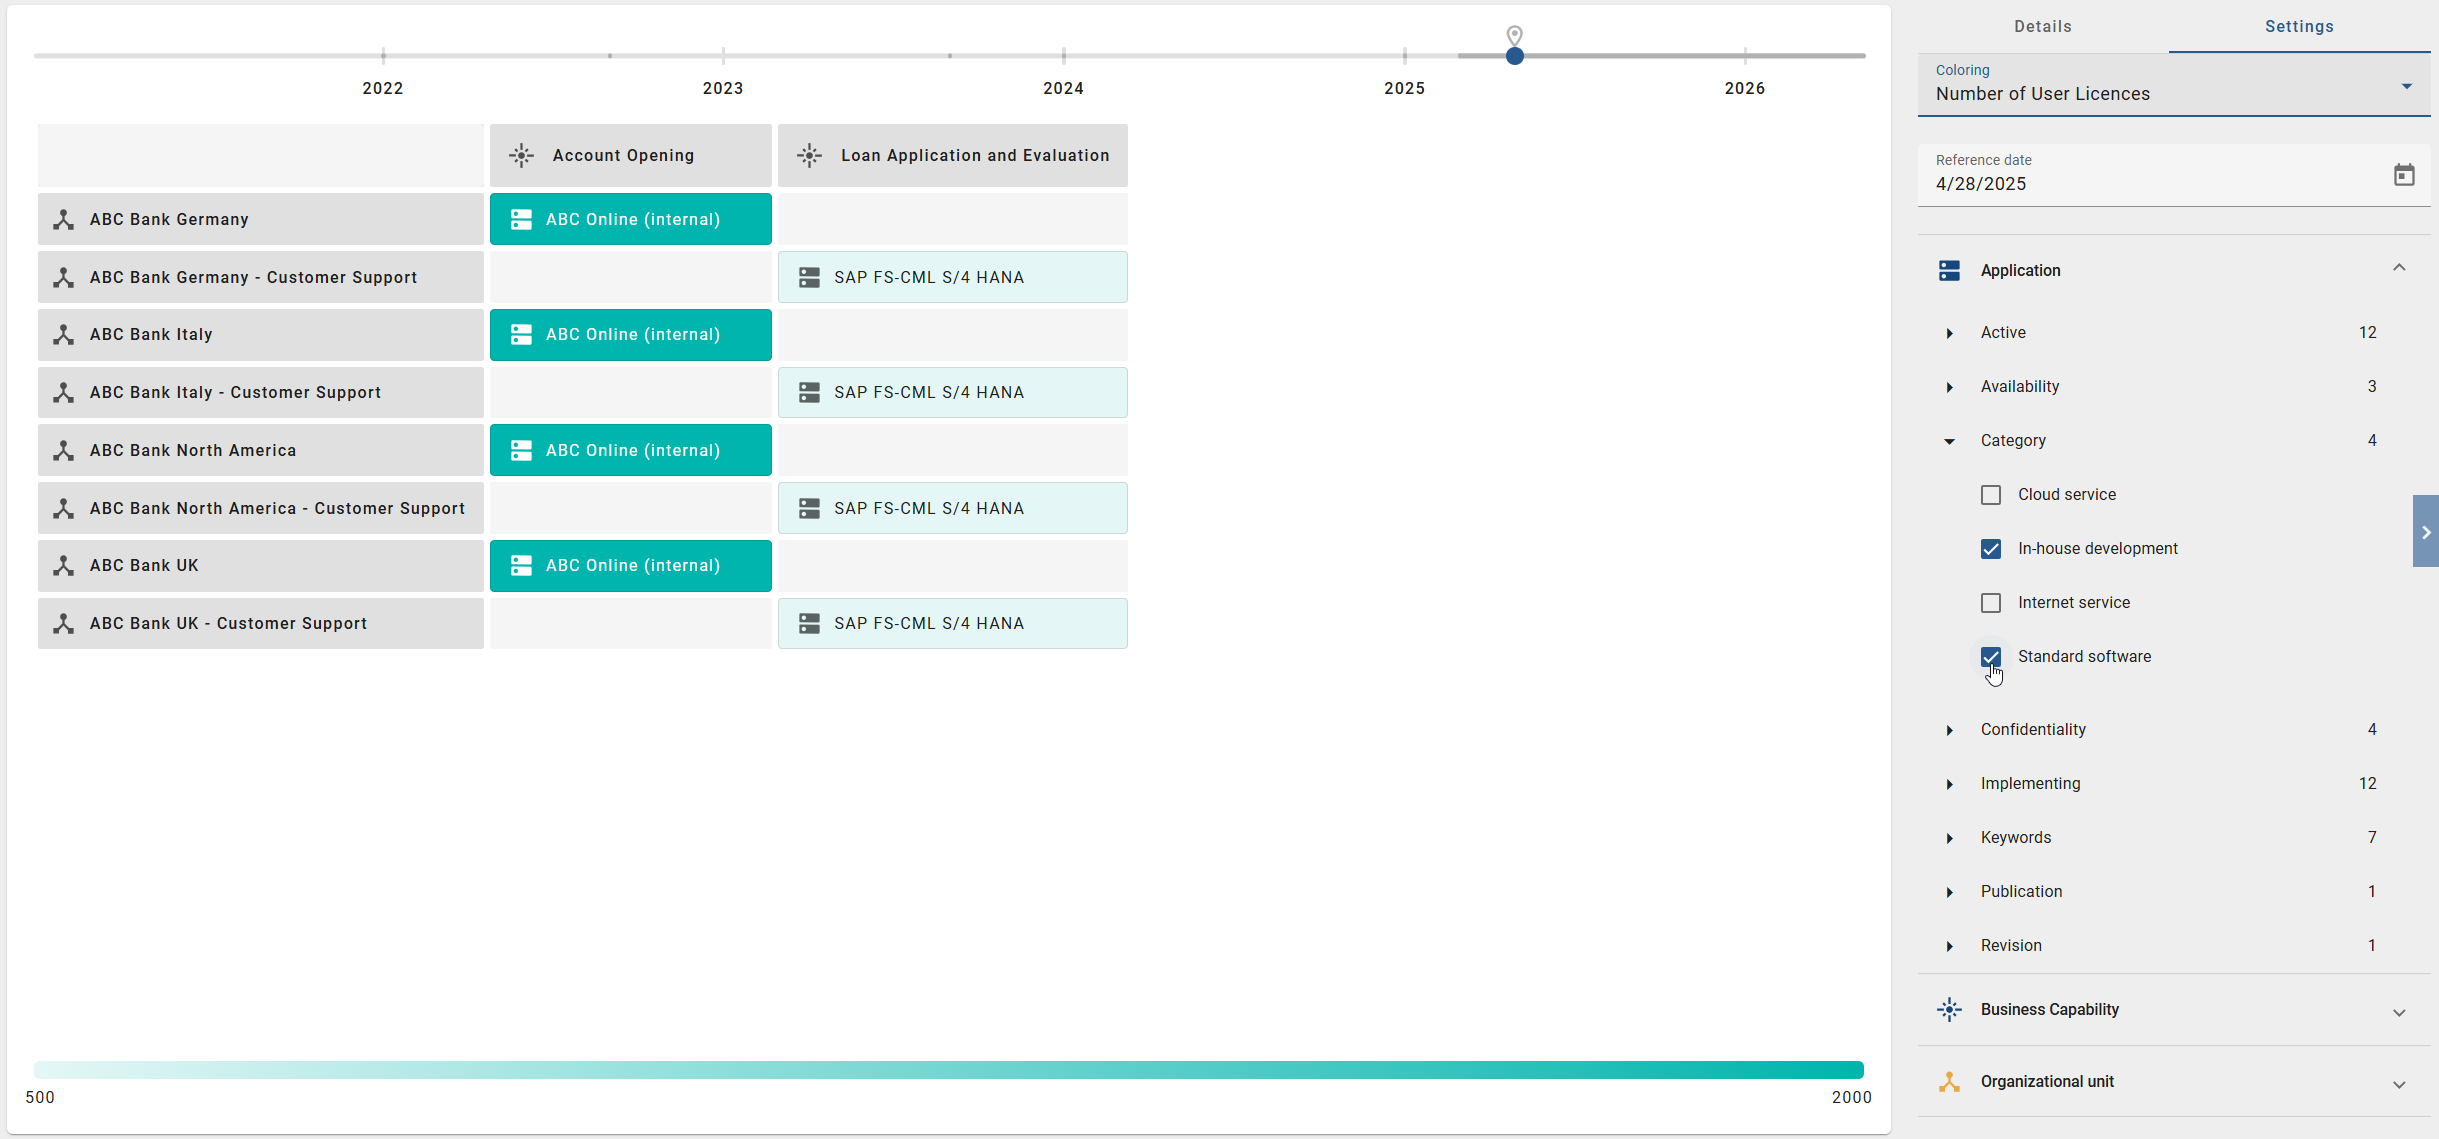
Selecting an Insight opens a 2D grid layout that is often used for reports, diagrams, or overviews in the Enterprise Architecture Management (EAM). Data from all diagrams in the selected repository and stage are extracted and related to the current day. If an access restriction for diagrams has been defined for you, these are excluded. This view helps to answer specific questions and gain insights.
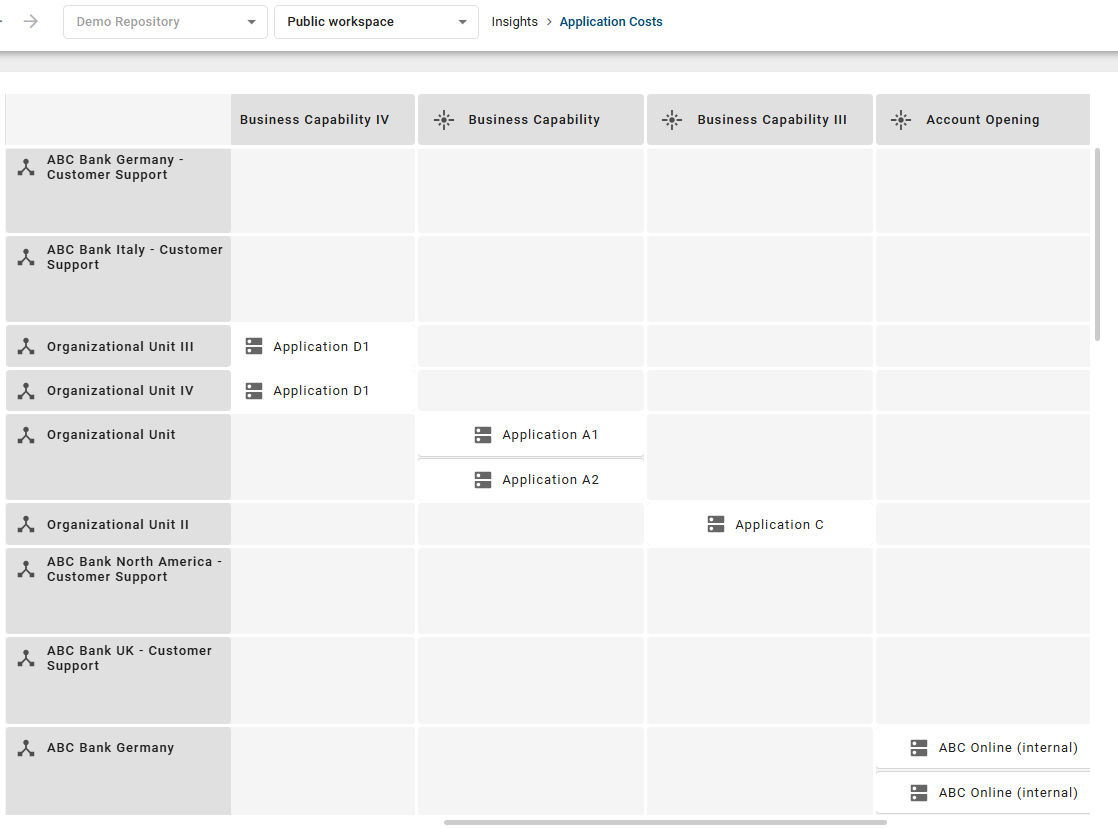
In this 2D grid layout, so-called target objects are displayed that are linked to one or two other source objects. The main objects and axis objects can be filtered in the Settings tab in the right sidebar. Additionally, you can color the main objects according to a specific attribute.
How can I view the details of an object used in an Insight?
Once BIC EAM has been purchased and activated, all users will be able to access Insights through the Insights menu item in the left menu bar. Here you will see a collection of predefined tiles. Selecting and opening a tile will display the relevant information.
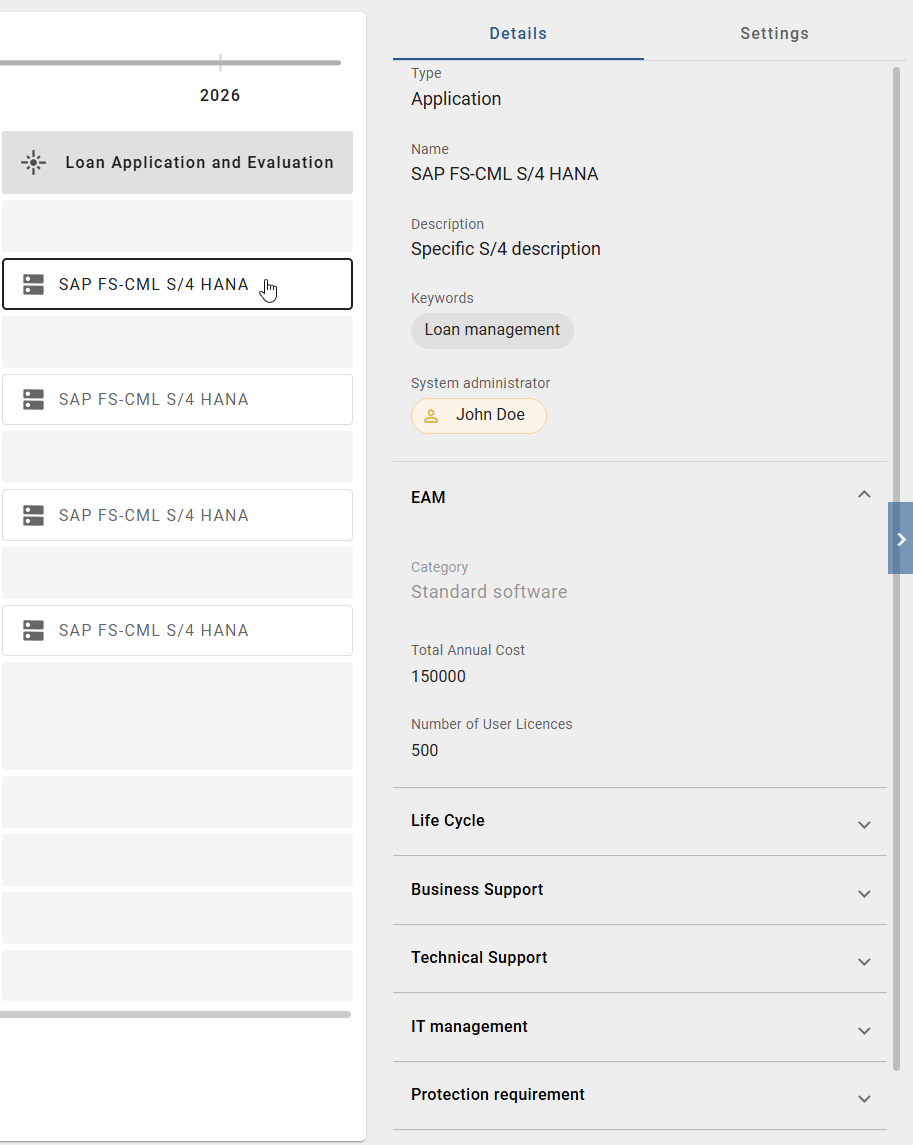
When you click on any object in the 2D grid layout, it will be highlighted. In the Details tab on the right sidebar, you will then see all available information about the selected object from your method.
Alternatively, you can right-click on a main or axis object in the 2D grid layout. Then select the Show Attributes option to display the related object details in the right sidebar.
How can I color main objects in an Insight?
Once BIC EAM has been purchased and activated, all users will be able to access Insights through the Insights menu item in the left menu bar. Here you will see a collection of predefined tiles. When you open one of these tiles, the relevant information is displayed in a 2D grid layout.
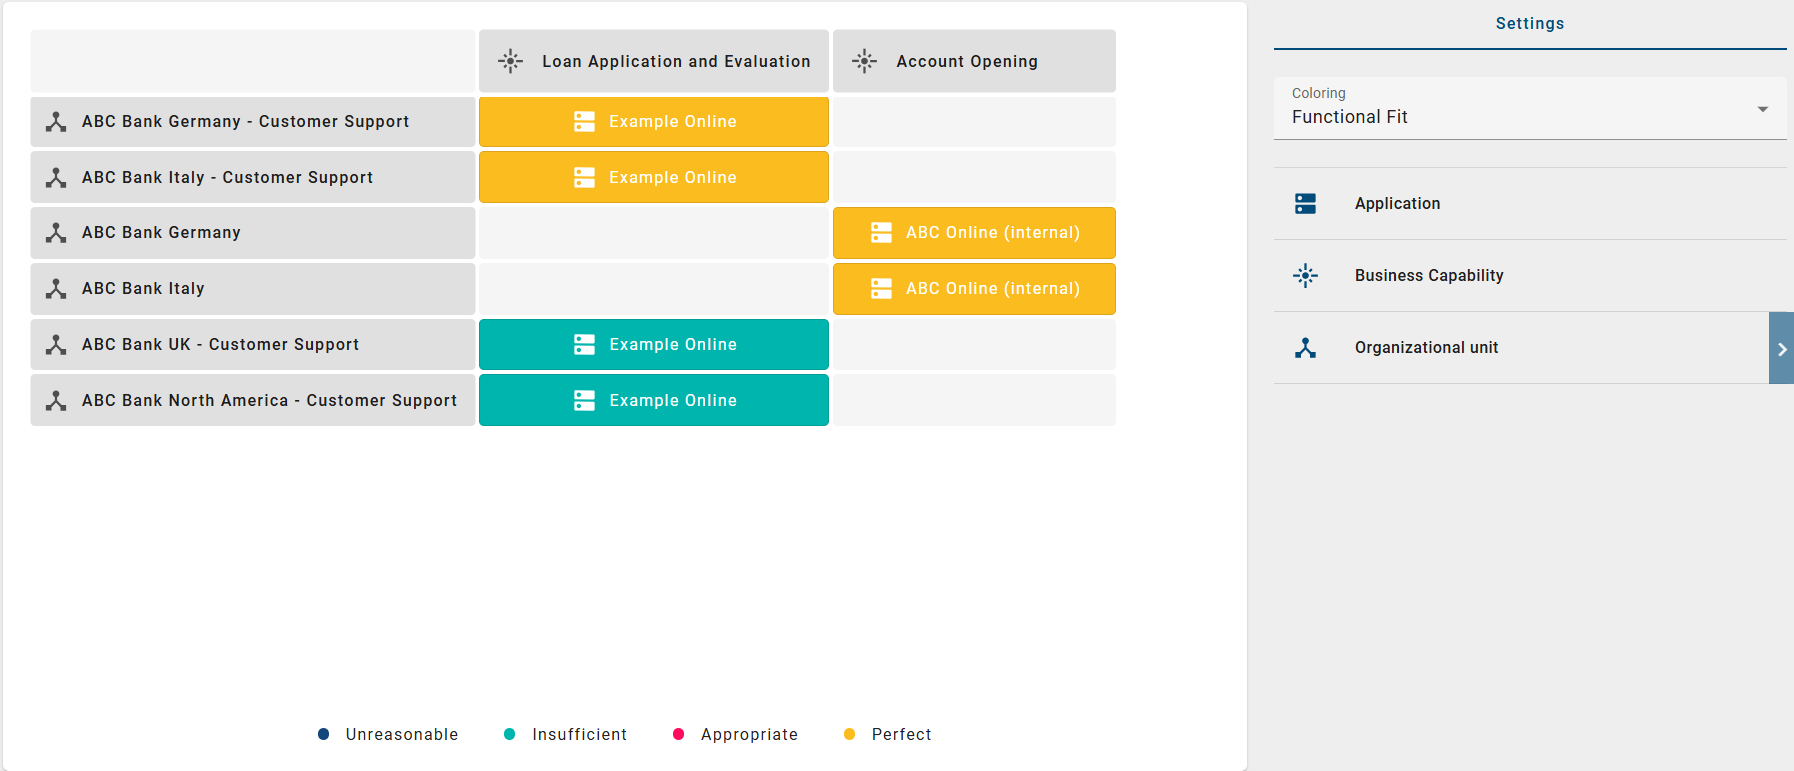
In this 2D grid layout, target objects are displayed, each linked to one or two source objects. You can filter the main and axis objects in the Settings tab in the right sidebar. Additionally, main objects can be colored based on a specific attribute. A legend at the bottom of the view explains the color assignment.
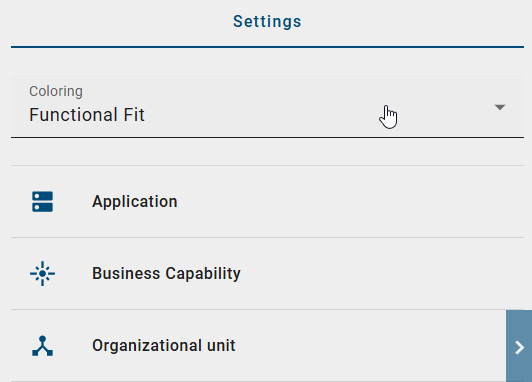
To color the main objects, click the Coloring option in the Settings tab in the right sidebar, which is displayed by default. This list contains all compatible attributes of the main object type.
When you select an attribute for coloring, the main objects are highlighted in color. The legend at the bottom of the view shows the color assignment. When you change the attribute, the color display within the select Insight is automatically updated with the new attribute. The legend at the bottom of the view is also updated based on the selected attribute.
How can I change the reference date of the data for Insights?
Once BIC EAM has been purchased and activated, all users can access Insights through the Insights menu item in the left menu bar. Here you will see a collection of predefined Insights. Selecting an Insight opens a 2D grid layout displaying target objects linked to one or two source objects. The data from all diagrams in the selected repository and stage is extracted and referenced to the current day. If an access restriction for diagrams has been defined for you, these are excluded.
By default, the data displayed in the Insight is related to the current day. However, it is possible to relate the data to a past date or up to 1 year in the future. To change the reference date, click the Reference date option in the Settings tab in the right sidebar, which is displayed by default. You can enter the date manually or from the selectable calender.
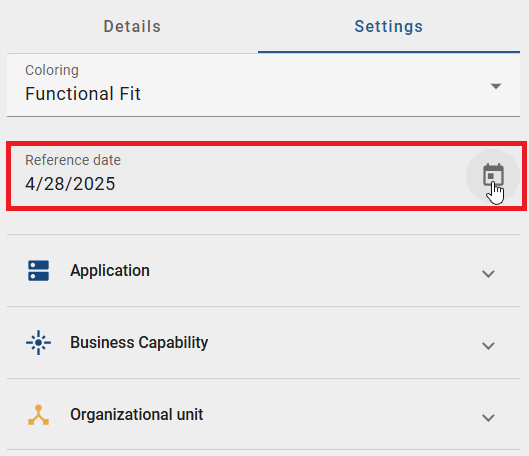
Alternatively, you can adjust the reference date using the timeline at the top of the view. The timeline displays years along with a marker for the current day. By moving the slider, you can navigate to the desired reference date, which is also displayed in the Reference date option within the Settings tab in the right sidebar.

Once you have changed the reference date, the data is immediately updated and the Insight is displayed accordingly. If you previously colored the main objects, this will be retained.
How can I filter the main and axis objects?
If BIC EAM has been purchased and activated, all users can access the Insights via the menu item Insights in the left menu bar. Here you will see a collection of predefined tiles. When you open one of these tiles, the associated information is displayed and shown in a 2D grid layout.
In this 2D grid layout, target objects are displayed, each linked to one or two source objects. You can filter the main and axis objects in the Settings tab in the right sidebar.
All main and axis objects used in the grid are displayed as filter facets in the right sidebar in the Settings tab. To filter for specific objects, click on a filter facet. Further filter options for that object type will then be displayed.
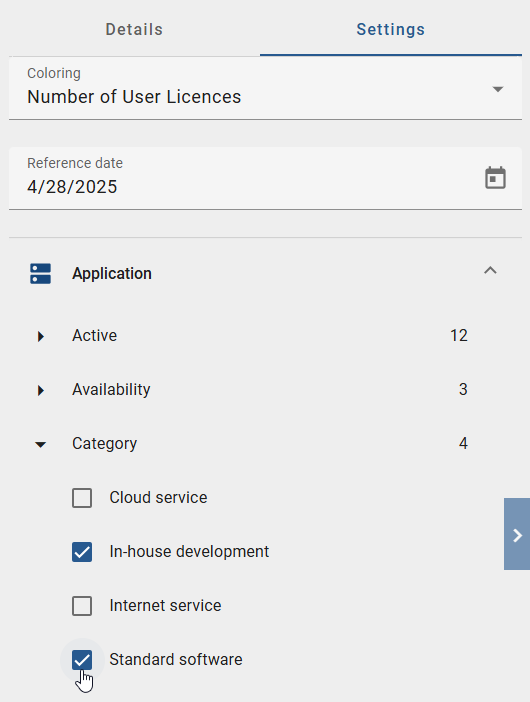
Once you have selected one or more filters by activating the checkboxes, the main and axis objects are filtered accordingly and the 2D grid layout is redisplayed.
How can I navigate to the corresponding diagram of an object displayed in an Insight?
Once BIC EAM has been purchased and activated, all users will be able to access Insights through the Insights menu item in the left menu bar. Here you will see a collection of predefined tiles. When you open one of these tiles, the relevant information is displayed in a 2D grid layout.
To better understand the context of a displayed object, right-click on any main or axis object within the 2D grid layout. The Go to occurence option will appear.
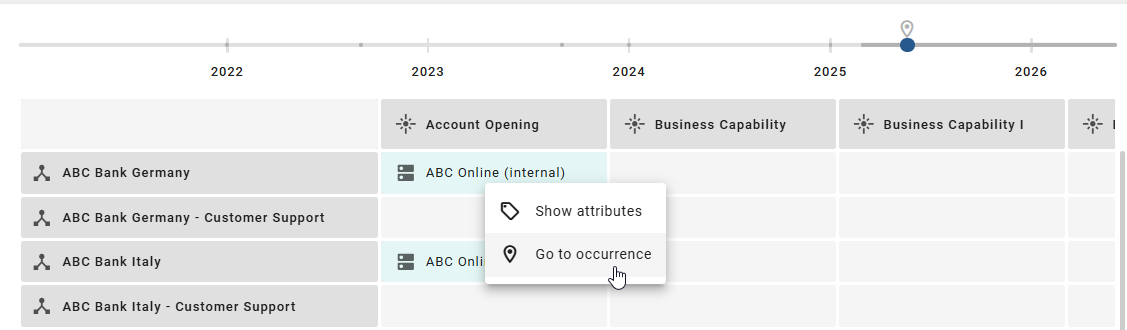
Clicking on this option will take you directly to the diagram where the selected object is used. Within the diagram, the object will be highlighted with a thick border and its details will be displayed in the right sidebar in the Details tab.
- alt
The screenshot shows a selected object in Insight and the option to call up its details via the right-hand sidebar.