Modeling
The modeling is done in diagrams in the local workspace. To switch from the public to the local workspace, the modeler must check out the diagram. The user can now edit the diagram, while it is locked for other users, so that no simultaneous changes can be made. The user can save the editing of a diagram, but the changes are not yet available for other modellers. They are stored in the “Local Storage” of the used browser. By checking in, the current state is being transferred to the BIC Process Design server and is visible in the public workspace. This gives other modellers access to the diagram and prevents data loss.
Warning
According to your browser settings, local work state may be discarded when the browser is closed or by clearing browser data. Regular check-in is therefore highly recommended.
Objects
How do I add objects to a diagram?
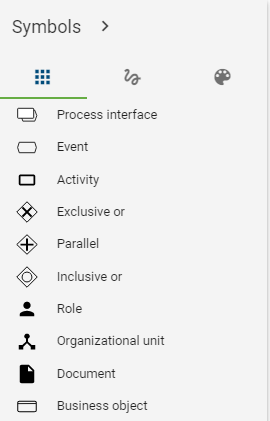
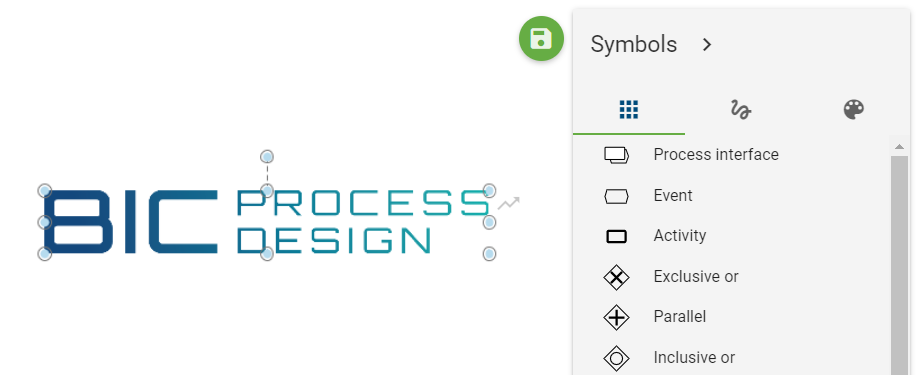
Symbol palette
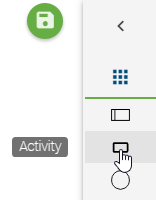
You have several options to place symbols from the symbol palette into the editor. The symbols available for modeling vary for each chart type.
Objects can only be modeled in checked out diagrams. There you will see the symbols which are available to the opened diagram type on the right-hand side of the editor (the symbol palette).
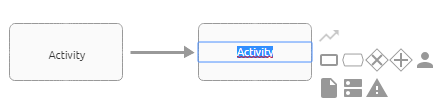
Drag & drop: Select a symbol that you want to place in your model and drag & drop it into the editor. After placement, the text field of the symbol is automatically selected so that the symbol can be named individually. Also note the Rename section when naming. Repeat this step for any symbols.
Stamp mode: You can use the stamp mode (the corresponding symbol is highlighted in the symbol palette), where you can create additional symbols of the same type. Select a symbol with a single click and place it by clicking into the editor. You can exit the stamp mode by pressing the ESC key or by clicking on the symbol in the symbol palette again.
Mini symbol palette
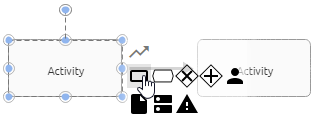
As an alternative to modeling with the symbol palette, it is recommended to use the mini symbol palette which displays all objects that can be connected to your current symbol.
Place or select a symbol in the editor. On the right side of the symbol some symbols will appear, which can be connected to the previously created symbol.
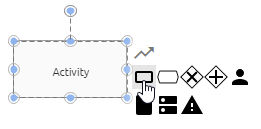
A connection between two symbols will be automatically created by placing a new symbol. The following options are now available. Also note the possible shortcuts.
Drag & drop: Select one of the symbols and place it in the editor while pressing the mouse button.
Releasing the mouse button creates the symbol including the connection.
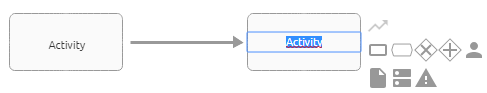
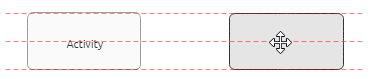
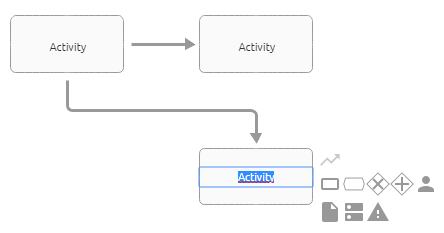
Quick Modeler: If the user simply clicks on an item in the mini symbol palette (no drag), a new object will be created immediately. The new node is placed centered at the same distance from the predecessor to the last symbol. The direction depends on the predecessor, because the new node is placed on the opposite side of the predecessor. If there is no predecessor, then to the right of the node and at a preset distance.
You can create multiple descendants for a node.
These are automatically created among each other using the Quick Modeler. Since the connection is centered, which means at the center port in the middle of the icon, it may overlap other symbols.
You can then reposition connections. Successors of successors are modeled either one below the other or one after the other, depending on the maximum distance to the predecessor in the x- and y-direction of the editor. By changing the position of the symbols you can adjust the behavior of the Quick Modeler.
The text field of the new symbol is selected so that it can be named individually. Also note the rename chapter.
Note
Depending on the symbol and on method, a selection menu for the automatically created edge may appear after placement from the mini symbol palette. To create the symbol, a selection must be made in this menu.
How can I create a personalized symbol palette?
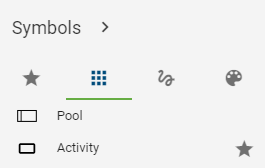
In the symbol palette, you can add objects that you frequently model to your personal favorite symbols. Hold the mouse over any entry in the symbol palette in the Symbols tab. A star frame appears next to the entry if it has not been marked as a favorite.
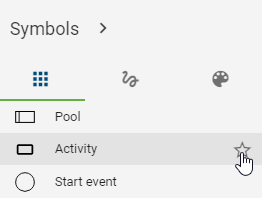
By clicking on the star you can add this object to your personal symbols. The star frame then remains filled in, marking your individually selected symbols.
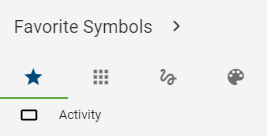
By marking an entry, the tab Favorite Symbols appears in the first place in the symbol palette. There, only your personal symbols are filtered and can be modeled from here. The order of entries is taken from the Symbols tab.
These settings are saved per user and per diagram type, so that each user can determine his or her individual symbol selection in each diagram type.
How can I remove favorites from my personalized symbol palette?
Got to the symbol palette to the tab Symbols. Navigate to the entry, which you want to remove from the favorite symbols. These are recognizable by the filled in, permanently visible star.
To remove, click on the star. Thus, only the frame of the star is visible, if you hold the mouse over the symbol. If no symbol is then marked as favorite, the Favorite Symbols tab disappears in the symbol palette. This tab is only visible if at least one entry is favored.
How do I create forms and graphical symbols?
Use the symbol view to navigate to the freeform symbols by selecting the second icon in the symbol palette.
Select a freeform icon from the list and place it in the editor.
For example, the following freeform symbols are available: rectangles, ellipses, text fields, triangles, cubes, arrows, etc.. You can label freeform symbols by using the multilingual text field. By double-click or pressing the F2 key after selecting the symbol, you can also trigger the input field. In addition, freeform symbols have some attributes. You can search for these objects, allow catalog suggestions, which you can configure via the freeform object in the administration area. An exception is the line symbol, which does not have these properties.
How can I hide the symbol palette?
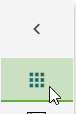
The Favorite Symbols, Symbols and Freeform Symbols can be hidden or collapsed with the symbol palette. Click on Collapse button next to the title.
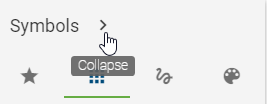
Now the symbol palette is collapsed and the associated title is hidden. Only the individual icons of the object types are displayed. If you hover over an entry, you can see the associated object type name as a tooltip.
Modeling by drag & drop and stamp mode works unchanged. By clicking the displayed title icon, the tab changes between Favorite Symbols, Symbols and Freeform Symbols.
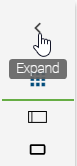
Click on the Expand button to unfold the opened tab of the symbol palette and to show it completely.
Note
The symbol palette “Format” does not contain symbols. Collapsing this tab is not possible, otherwise the options would not be selectable.
How do I move an object?
You can reposition an object by drag & drop. To do this, select the object with the left mouse button and keep it pressed while you navigate the mouse to the desired position. The object moves with your mouse. If the desired position is outside the current diagram section, you can also move the diagram view field by pressing the right mouse button or using the scroll wheel while holding the object with your left mouse button. When you release the left mouse button, your object is placed at the mouse position.
Optionally, you can use the arrow keys on your keyboard to move the object in all directions.
Note
You can also move a multi-selection of objects using this procedure.
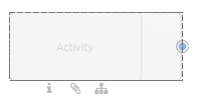
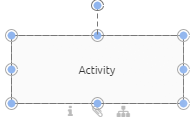
How do I change the size of an object?
Select the object you want to change with a single click.
Press the left mouse button to alter the size of the object by using the blue points along the edge. Release the mouse at the desired position.
How can I switch the symbol of an object?
Within the modeling process of your diagram you have the possibility to change the symbol of an already modelled object. This can help you to dynamically change the view on single elements in your diagram according to your needs.
To change the symbol of an object within your diagram proceed as follows:
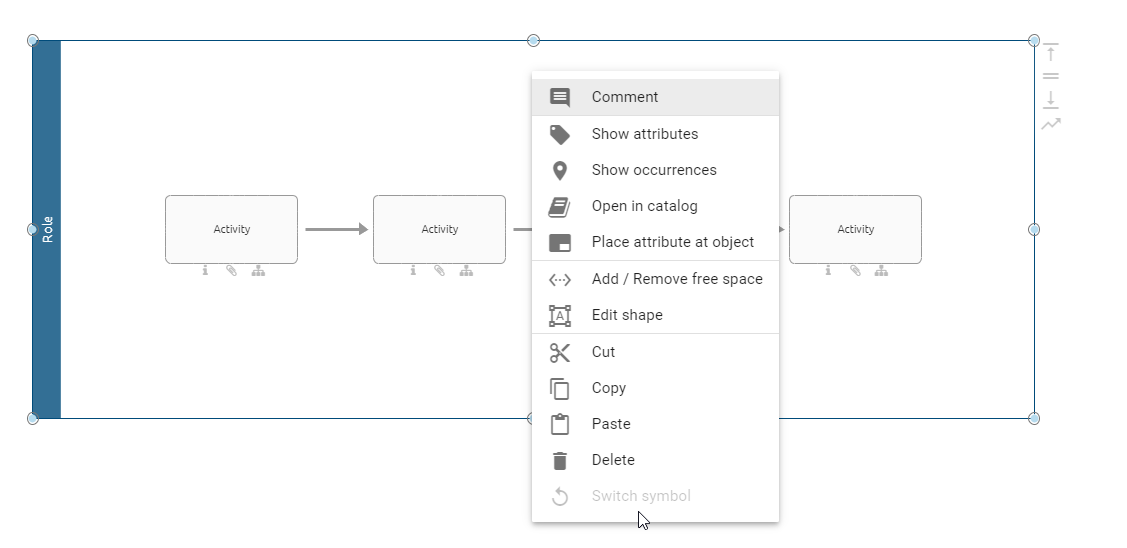
Right click on the symbol you want to change within the checked out diagram. The context menu for the object appears.
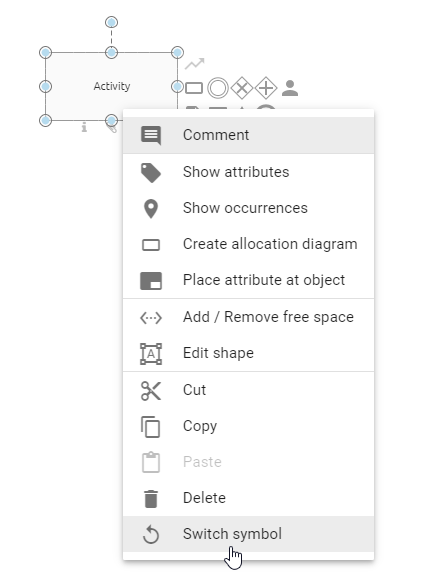
Select the entry “Switch symbol”. You will get a list of all symbol types, which are allowed for the given diagram type.
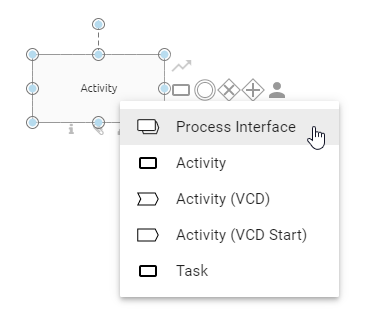
After you have selected the desired symbol type, it will be displayed in your diagram.
Symbols of container objects, such as pools, cannot be changed as soon as the object concerned already contains elements. In this case, the function for changing the symbol for this object is no longer available and is greyed out in the context menu.
Note
Symbols that are already part of a pool can not be switched into the symbol type pool. By switching the symbol, placed attributes will be reset to its default. If no attributes are placed at the symbol by default, then no attribute will be placed after changing the symbol.
How can I label or rename objects in the editor?
The writing area is displayed directly after modeling an object or by double-clicking on the object. A suggestion list for all the catalog entries used in the diagram is then displayed. You can now select a proposal with a mouse click or label the object. When labeling, you can also choose from a suggestion list with catalog entries of the server that contain the entered term. Otherwise, end the entry with a single click in the editor.
Optionally select the object by clicking on it once and press F2 so that the writing area is displayed.
You can also rename symbols using the attribute bar.
Note
Note some peculiarities when renaming and editing attributes of symbols in diagrams that are catalog entries.
How can I name activities in the editor using AI?
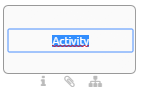
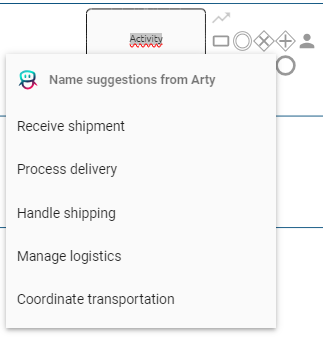
Once you have checked out a diagram in the editor, you can select an activity from the context palette and place it on the canvas. Our AI assistant, Arty, will then generate a list of various activity names, which will be displayed under Name suggestions from Arty. The suggestions are based on the content of the diagram and will be presented in your current content language.
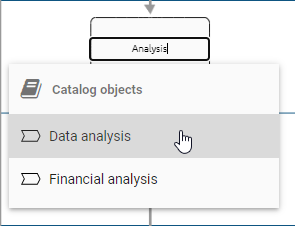
You now have the option to either select a suggestion by clicking on it or manually label the activity. If you prefer to enter a name manually, simply click on the activity’s name label. Alternatively, you can select catalog items from a suggestion list of Catalog objects that contain or are similarto the entered term. To finalize the entry, click anywhere else in the editor.
Hint
This function is performed by Arty, our AI modeller. It is part of the AI Modeler package, for which a separate licence is required. Please also refer to the notes on using the AI feature.
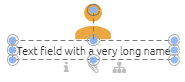
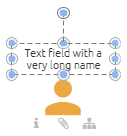
How do I change the size, line breaks and the position of text fields (labels)?
You can change the size of some text fields which contains the symbol’s name (if the name, for example, is very long, you have the option to display it in two lines (by alerting the size of the label) and to shift automatic line breaks). Alternatively, you can add manual line breaks. The text field can be positioned as you like.
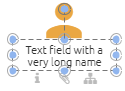
Change size
Select a text field by clicking on it.
Alter the size by using the blue points along the edge of the text field. Release the mouse button at the desired position.
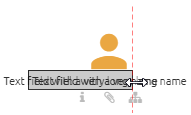
Position
Select a label by clicking on it. Then click again, keep the mouse button pressed, move the field and release the mouse button (drag & drop).
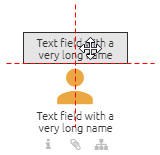
Note
Note that the size and position of the text fields of symbols with block form, such as activities, cannot be changed. For those symbols, the label is located in the respective symbol. Furthermore, manual line breaks can not be seen in the catalog, but are visible in the reports.
Connections
Where can I place a connection to an object?
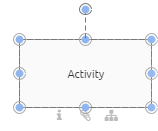
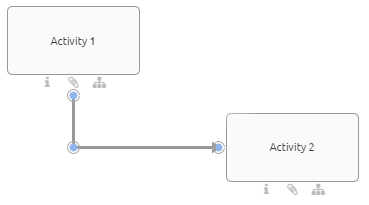
All possible options for placing a connection are indicated with a red dot when you hold the connector with the mouse over different points of an object.
If you link objects using the outer port, the connector will stay fixed at that side of the object even when you shift it.
If you link objects using the centerport, the connector will move when you shift the object.
Connection can be added via drag & drop or by selecting the start and end ports (depending on the connection type). This is explained in the following.
How do I change the link type?
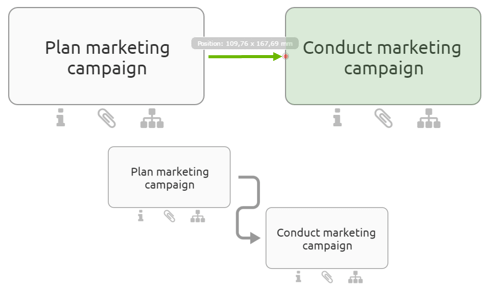
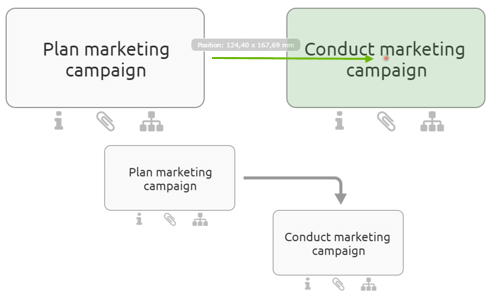
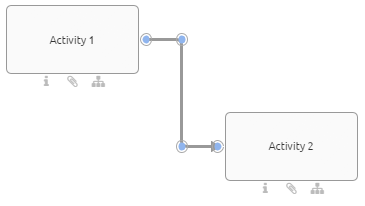
You can connect symbols using an orthogonal or diagonal connection. Orthogonal connections are horizontal or perpendicular resp. they are a combination of such lines. A connection of the type diagonal goes straight from the start to the end port without any bending. The active connection type is displayed in the menu bar as Change link type button. Select the button to change the type.
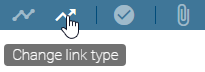
The symbol of the button changes accordingly: orthogonal - angled arrow, diagonal - straight arrow. If you draw a new connection between two symbols, the connection will be straight resp. orthogonal.
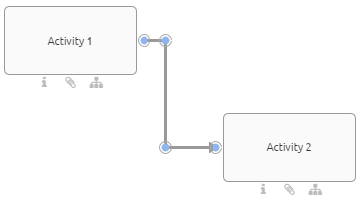
How can I connect symbols orthogonally?
You have the following options to add an orthogonal connection between two symbols. The connection type can be switched in the menu bar. If the connection type button shows an angled arrow, the connection will be orthogonal
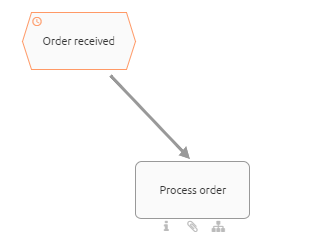
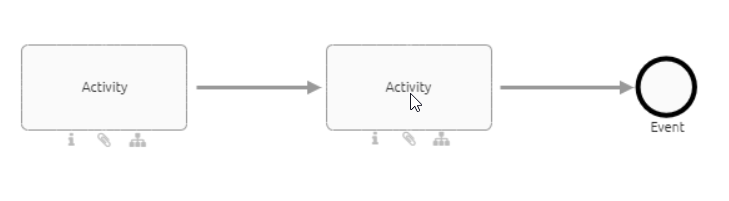
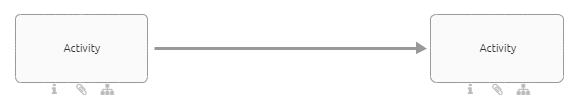
Insert the desired two symbols into the editor or open a diagram with at least two symbols which can be linked (e.g. an event and an activity).
Connection icon
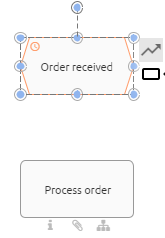
Select one of the symbols in the editor. A connection icon appears in the mini symbol palette (upper right corner next to the symbol).
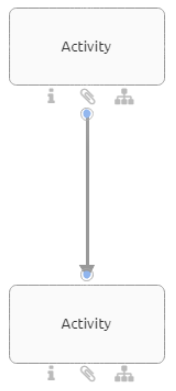
Select the connection icon and afterwards a desired point at the other symbol. A sequence is added between the two symbols.
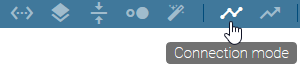
Connection Mode
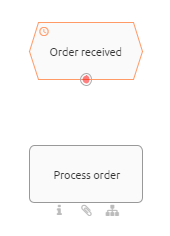
If you activate the connection mode, you can add several connections. In the menu bar, click Connection Mode. A red dot appears on the edge of the icon when you hold the mouse pointer over it. This dot shows the possible start points. Select the point where you like to start your connection.
Then hold down the mouse key over the second symbol and select the location where you want to place the end of the connection. A sequence is added between the two symbols. Deselect the symbol afterwards by a click on a free space. Then you can start a new connection.
To terminate the connection mode, click on the connection mode-button again.
Port area
Hold the mouse over the edge of a symbol for a while without clicking it. The connection mode becomes active. Now you may add a new connection as described for the connection mode. The connection mode will be deactivated automatically after you added one connection.
How can I connect symbols diagonally?
You have the following options to add an diagonal connection between two symbols. The connection type can be switched in the menu bar. If the connection type button shows a straight arrow, the connection will be diagonal
Insert the desired two symbols into the editor or open a diagram with at least two symbols which can be linked (e.g. an event and an activity).
Connection icon
Select one of the symbols in the editor. A connection icon appears in the mini symbol palette (upper right corner next to the symbol).
Select the connection icon and draw a connection between the current symbol and another by using the drag & drop function.
Connection Mode
In the menu bar, click Connection Mode. A red dot appears on the edge of the icon when you hold the mouse pointer over it. Click on one of the symbols where you want to start the connection.
Press and hold down the mouse key and move to the second symbol. Release the mouse key at the location where you want to place the end of the connection. Then click on the connection mode-button again to terminate the connection mode.
Port area
Hold the mouse over the edge of a symbol for a while without clicking it. The connection mode becomes active.
Now you may add a new connection via drag & drop as described for the connection mode. The connection mode will be deactivated automatically after you added one connection.
How do I change an existing link to another link type?
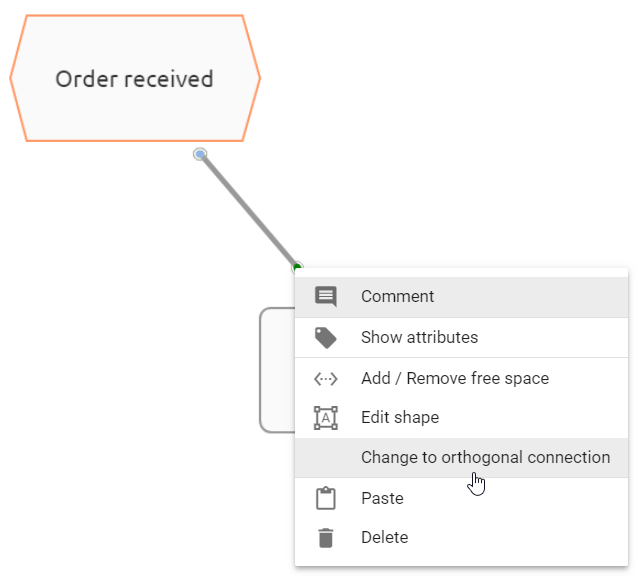
Select an existing connection between two symbols and open the context menu by right-clicking. After that select the Change to straight connection or Change to orthogonal connection entry. The connection is then changed.
How can I change an existing link?
The connection sequences are created automatically when a connection is created. You can change both its path as well as the input and output.
Select the connection you want to change.
Change path
You can move the blue points of a connection by using the drag & drop function.
If you want to create a new nook, click on the desired location and drag a corner into the connection.
Change the port of an existing link
Use the blue points on an object to change the location of the connection on the same symbol. Simply drag & drop the existing link to another dot along the edge. Any possible inputs or outputs are indicated by red dots.
Disconnecting and reattaching connections
An existing connection can be disconnected from one symbol and reattached to another symbol with a drag & drop function. This is possible for both the source and target symbol.
How can I label or rename connections?
The label is directly displayed by double-clicking on the connection. You can now label the object. Click somewhere within the editor to finish the entry.
Optionally select the connection by clicking on it once and press F2 so that the label is displayed.
How do I insert an object into a path?
You can insert an object into an existing path using Drag & Drop. The connection between the corresponding objects has to be defined in the method.
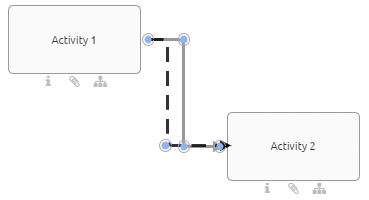
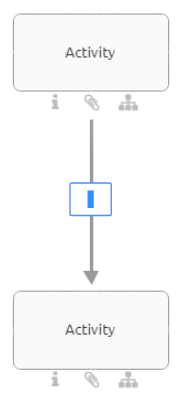
Drag a new object from the symbol palette or a free object from the editor to the desired edge. This edge must be of the type sequence flow. When it appears blue and dashed, you can drop the object.
The edge is exchanged by two new edges where the new object is an intermediate node in between the two former objects. All attributes and the optional label of the old edge are copied to the newly created edge where the placed node is the target node.
If you remove the new object, the edge returns to its previous state and connects the initial two objects. In case the object types do not allow a connection, the edge does not change its layout as described above. Dropping the new object will place it on top of the edge without any connection.
Copy, paste and more functions
How do I copy and paste symbols?
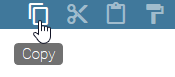
Select one or more symbols that you want to copy within a diagram or between diagrams. Then click the Copy-button in the menu bar (alternatively CTRL+C).
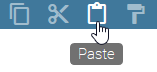
Click on the Paste-button in the menu bar (alternatively CTRL+V).
Optionally you can right-click on an object or in the editor to open the context menu and select Copy or Paste.
You can paste objects into another diagram of different type (e.g. EPC to BPMN) if the object is available in the target diagram type. When you copy several objects, each object is checked for this requirement and pasted when applicable. If you want to paste an object which is not allowed in target diagram it will not be pasted. Furthermore, Connections will only be pasted between two pasted objects, i.e. if an object could not be pasted its connections to other objects will also not be pasted. If an object is allowed in the target diagram but the symbol of the object is not, the object will be pasted with the standard symbol. If an element could not be pasted, you will be informed about the reason for that.
Note
Copying catalog entries and symbols that are not part of the catalog differs. Regardless of the object type, copies of catalog entries are always reused. This means that an expression copy is created and the object remains the same. Changes to this copy will also cause changes to the original if the catalog entry has not yet been accepted. Objects that are not in the catalog are doubled, a definition copy is created. Changes to the copy are thus independent of the original.
There are also differences in copying connections. A copied connection is newly created if one of the connected and also copied objects is a definition copy; this is the case if one of the objects is not a catalog entry. A connection is reused if the connected objects were occurrence copies; this is the case if they are both catalog entries.
Note
Please note that when copying elements, relationship attributes are not automatically taken over. This means that if you copy an activity, for example, the associated role is not automatically copied as well. Make sure that you transfer relationship attributes separately if this is necessary.
How can I cut symbols from a diagram?
Click on a symbol that you want to cut. Now use the Cut-button in the menu bar to select the desired symbol (alternatively CTRL+X).

Optionally you can right-click on an object to open the context menu and select Cut.
How can I delete symbols from a diagram?
Right-click on the symbol you want to delete to open the context menu and select Delete.
Optionally, you can delete selected symbols via the “Del” button on your keyboard.
If the object is connected with other objects via exactly one incoming and one outgoing edge of type Sequence Flow, a new edge of the same type is created. This connects the neighboring objects with each other in the same direction. The attributes of the previously incoming edge are adopted for the new connection.
Deleting symbols in the diagram does not automatically delete associated catalog entries in the catalog. This creates unused catalog entries, which can be reorganized.
Note
You can also use the multi-selection of symbols to delete several symbols at the same time. The new edge is also created here for the neighboring symbols, but without the transfer of attributes.
How can I undo or redo modeling steps?
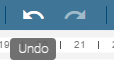
To undo individual modeling steps, select the Undo-button in the menu bar or alternatively CTRL+Z.
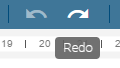
Use the Redo-button to restore steps. Alternatively, press CTRL+Y.
The Redo-button and Undo-button can be used until the diagram has been changed.
How do I add images to a diagram?
You have the option to add images which have the file formats jpg, jpeg, bmp, png and gif (without animation) to a diagram. To do the execution of the following steps is necessary:
Check out the diagram into which you want to insert an image. Now you can navigate to the memory location of the image and drag it into the editor.
Tip
The functions Edit shape, Format and Change size can be used for editing an image. For example, you can crop your picture or set a frame.
Note
Copying images between different browser tabs is not supported.
Note
Files stored in interlace mode, such as available for PNG files, are not fully supported. This includes the print preview. In this case, saving the affected file without interlacing and inserting it into the modeling is recommended.
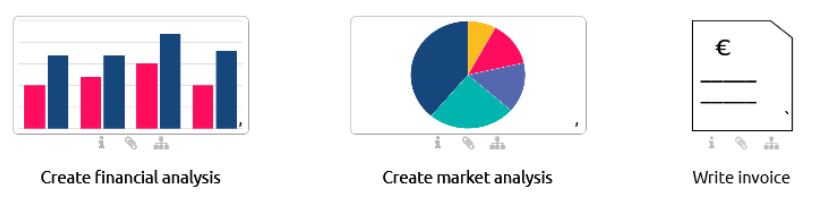
How can I add an image to an activity?
You can add an image to an activity (or any other object). This can be helpful, if you want to create navigation objects and want to highlight them.
To do that, you need to do the following:
Check out the diagram in which you want to add the image. Copy the image which you want to add. Select the activity (or other object) that the image should have as background. Paste the image (Ctrl+V).
Formatting
The different formatting options affect not only free-stream symbols but also symbols, such as activities and connections.
How do I change the format of symbol and diagram?
Navigate to the format settings in the symbol palette by selecting the third icon on the symbols menu.
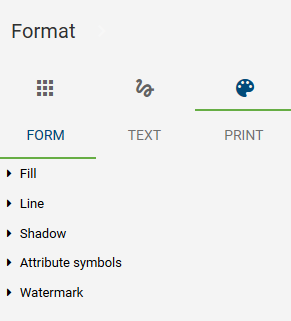
Select an existing symbol (or several symbols at a time) in the editor. You can now choose between Form, Text and Print.
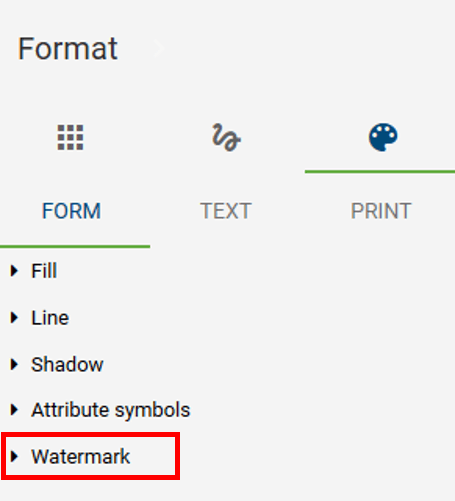
If you select the Form menu item, you can format fill, line, shadow, attribute symbols and watermarks for the selected symbol.
What options do I have to format objects?
Available settings for the form of symbols:
Fill: You can choose between the following options for the filling of a symbol: None, Solid or Gradient. You can also adjust the color and transparency of the filling.
Line: For the line of a symbol, you can select whether there is no line or a solid line. Furthermore, the transparency and the color can also be set. In addition, you can set the style of a line (for example: dotted line, etc.) and the line width. With open symbols, such as connection or the freeform symbol line, you can change the edge shape as well as the arrow type. To adapt these characteristics the following options are available: Line End, Line Join, Start Arrow Type and End Arrow Type.
Shadow: You can choose different shadow types for a symbol. The color can also be set here.
Attribute symbols: You can enable or disable the display of attribute symbols for an object. Attribute symbols are the icons that appear below an object, for example when a description has been maintained.
Watermark: You can enable or disable the display of watermarks and create them for symbols. In this case, there is a wide range of adjustment options, such as, for example, the adaptation of the size and color of the watermark.
Background: You can use an image as a background for an object.
Note
In the administration, you can configure the coloring of the symbols in the local workspace for all diagrams in your BIC Process Design.
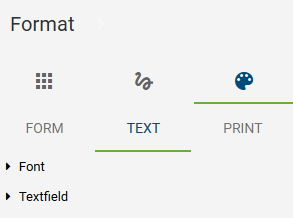
What are the options to format text?
Available settings for the text in symbols:
Font: The font, size, color and style of texts can be changed.
Textfield: Defines the behaviour of the text field, e.g.: do not resize form, etc. Furthermore, you can define the position of the text field. Your options are: at the left, right, upper and lower text margins.
How can I save print settings in the diagram?
Use the symbol palette to navigate to Format and select the menu item Print. The editor then changes to the print preview (including sheets and page margin). There you can make some print settings for your diagram.
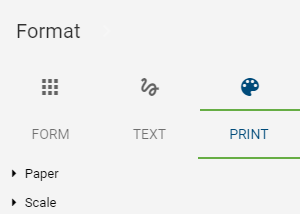
Paper: Different format and orientation settings can be selected here.
Scale: Page limits and the factor of scale can be set here.
When saving and checking in, these settings are taken over for the diagram, just like other formatting. Thus, users with the rights of an author can set user-independent presets for printing. These are then automatically displayed in the print preview. They can also be individually changed there, but not saved across the board.
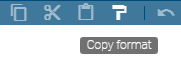
How can I transfer a formatting?
The copying of a specific formatting is available to modelers as a functionality in the menu bar. This allows you to transfer formatting from one object to the next.
Select your formatted object by clicking on it once. Then, in the menu bar, select Copy format. Once you click on the button, you can transfer the format to another object. If you double-click, you can edit several objects.
Click on the object to which you want to transfer the formatting. With a click somewhere in the empty editor or pressing ESC you can cancel/exit the Copy format mode.
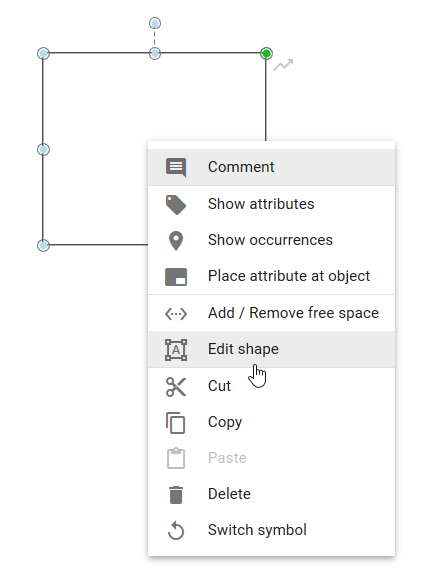
How do I change the shape of symbols?
You can change the shape of existing symbols.
Select a symbol in the editor that you want to modify and select Editing by right-clicking in the context menu. It is now possible to edit individual points of the symbol, which allows you to change the shape of the predefined icons.
Change the symbol by moving an editing point to a different position while holding down the mouse key. You can repeat this for further processing points. The editing mode is active until you click somewhere in the editor. The same processing also applies to connections.
Support for visual adjustments
How do I rotate symbols?
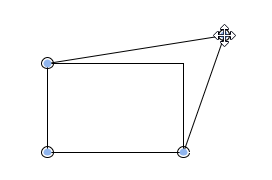
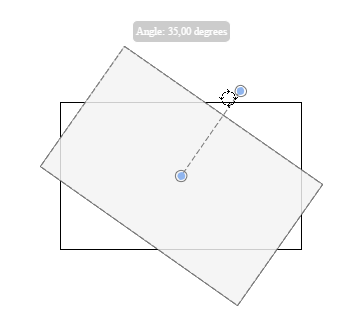
You can change the orientation of symbols in the editor. That means it is possible to rotate symbols to any position you like. Analogous to the position and size, it is also possible to change the orientation of symbol names independently of the orientation of their symbols.
Click on a symbol in the editor. If you only want to change the orientation of the name, click on the symbol twice. A circle appears above the symbol. Select the circle above the symbol by mouse click and drag it to the left or right to change the orientation of the symbol. This allows you to rotate the symbol for example by 90 degrees.
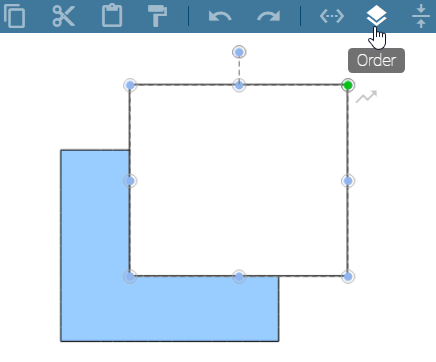
How do I change the order of symbols?
You can define the order of overlapping objects in the editor. This applies to all objects you can use in the editor, including free forms and connections.
Select the object. Then navigate to the Order-button in the menu bar.
Four options are available:
Foreground: The selected object becomes the top level of the overlapping objects.
Background: The selected object becomes the lowest level of the overlapping objects.
Move up: The selected object is set one level higher.
Move down: The selected object is placed one level lower.
Once one of the options is selected, the arrangement of the symbol changes accordingly.
Note
Recently created objects always lie within the topmost plane of arrangement. This layer can still be changed later. Pools always lie within the lowermost plane of arrangement due to their technical meaning.
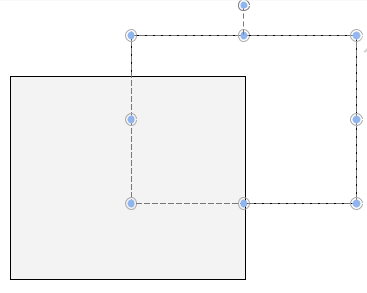
How do I use the alignment tool?
To simplify the positioning of symbols, you can use the alignment tool, both for existing symbols as well as for the creation of new symbols in the editor.
Open an existing diagram that contains symbols and drag a symbol from the symbols view into the editor. Afterwards, align the symbol with other symbols by placing it beneath another one. You will see that alignment lines are displayed. They can appear at the outer edges of symbols as well as through the center of a symbol, depending on the position to other symbols.
You can turn off the alignment tool by pressing the Alt GR key while positioning the symbol.
Warning
In the Google Chrome browser you can turn off the alignment tool with Alt and Alt GR. When using Internet Explorer, keep in mind that the Alt key opens the menu bar of the browser. So please only press Alt GR for turning off.
How do I align symbols to each other?
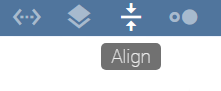
You can use an Alignment function to align symbols to each other.
To do so open a checked out diagram that contains elements that you want to align to each other. Select several elements at the same time, either by dragging the mouse with pressed key over the area in which these elements are located, or by using the Shift key and clicking on the symbols. To finish, select Align from the menu bar and select an entry (for example, Top align). The elements are aligned to each other according to the first selected entry.
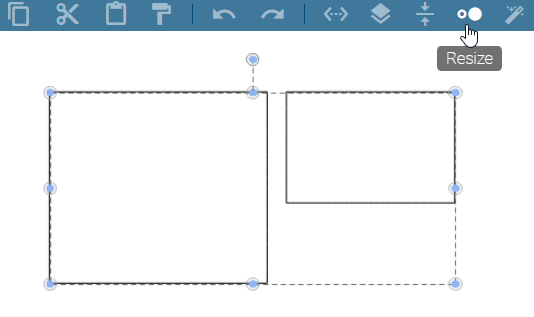
How do I match the size of symbols to each other?
Open a checked-out chart that contains items whose size you want to match. Then, select several elements at the same time, either by dragging with pressed mouse key over an area in which these elements are located or by using the Shift key and clicking on the corresponding symbols.
Select Resize from the menu bar and select an entry (for example, Fit to largest Shape). The size of the elements is adjusted accordingly.
How do I add or remove space?
With the function Add/ Remove Free space, you have the option to insert or remove space between symbols when being in the editing mode.
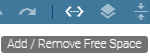
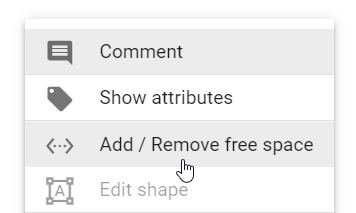
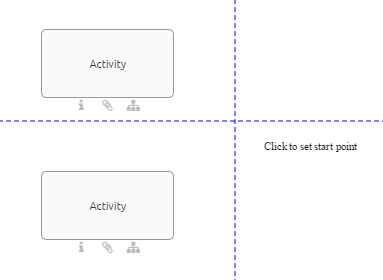
Open the context menu by right-clicking in the editor and select the entry Add/ Remove Free space there or in the menu bar. Alternatively, you can access the function by a click on the option Add/ Remove Free space in the menu bar. Two blue dashed lines appear, one running horizontally and the other vertically through the diagram.
Click on a point in the diagram to set the start point where you want to start removing or adding free space.
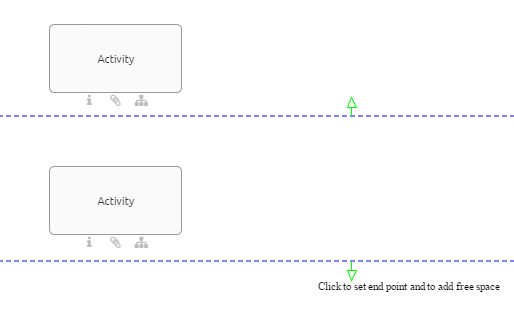
Add space
Click on a point in the diagram that is located on the right side or underneath the start point to add free space.
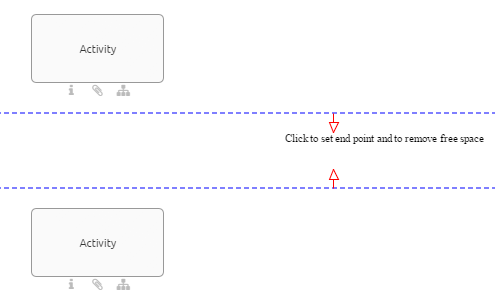
Remove space
Click on a point in the diagram that is located on the left side or above the start point to remove free space.
How do I use the layout assistant?
The layout assistant helps you to layout the process flow. This means that the sequence flow and activities are in the foreground. The layout assistant is by default only available for the diagram types BPMN, EPC and VCD. In edit mode, of these diagrams you can layout the selection of a container object, multi-selections as well as the entire modeling. After layouting, the diagram is positioned at the 0/0 corner. In order to layout the whole modeling, you should not select anything in the diagram or select a symbol, which is not a container symbol. Your selection persists after layouting.
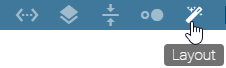
Navigate to the menu bar and click Layout in edit mode. This will automatically layout the objects involved in the process. In the meantime, the editor is overlaid by the corresponding message. It is distinguished between satellites and sequence flow.
Satellites: The various satellites associated with an activity, such as roles and documents, are divided into quadrants according to their modeled position. Within this quadrant, the satellite is automatically positioned uniformly depending on the modeling. Furthermore, the edge ports are reassigned here. The arrangement of the edges in EPK diagrams takes place on the right and left side of activities. In BPMN diagrams, the ports are created at the top and bottom of activities.
Sequence flow: Mainly underlying activities are assigned to a column. In the same way, adjacent activities are assigned to rows. Within these rows and columns, the activities are arranged in a straight line using the layout assistant. An activity including satellites is considered as one related object. This affects the height and width of columns and rows. Sequence and message edges between activities reassigned if necessary.
Note when layouting containers in the diagram:
If you want to layout the whole diagram with a container in it, the size of the containers is adjusted in addition to the changes described. The containers thus keep a configured distance from the internal elements. When resizing, however, the header side of pools is excluded, so that no configured distance is kept there.
If a container, such as a horizontal or vertical pool or lane, is selected, the layout assistant takes the symbols within this container into account. The layout of the elements in any container always follows the same rules, while the container size remains unchanged.
This chapter describes the default settings. The layout may behave differently, if the settings for the corresponding diagram type have been adjusted in the administration area.
Note
The layout assistant does not support the simultaneous use of horizontal and vertical pools within a diagram.
How can new symbols be automatically layouted?
The layout assistant is permanently activated by pressing CTRL -key and simultaneously clicking on Layout. The associated icon remains highlighted in the menu bar. When creating new symbols with one click via the mini symbol palette, the symbols are directly routed and placed in the corresponding position.
With CTRL and left mouse button, the permanent setting can be deselected again. A single click on Layout still corresponds to the Layout described above.
Note
The “Undo” and “Redo” modeling features exclude these layout assistant changes.
BPMN Collaboration
How do I work with pools and lanes?
This chapter explains the modeling of a BPMN collaboration diagram. In contrast to other objects, lanes are not dragged from the symbol palette into the editor, but can be generated via a pool. This prevents lanes from being loosely modeled (i.e., outside of pools), which is not allowed according to the BPMN standard of OMG.
Create a pool:
Open your BPMN diagram and check it out or create a new BPMN diagram. Afterwards, use drag & drop or stamp mode to model a pool from the symbol palette.

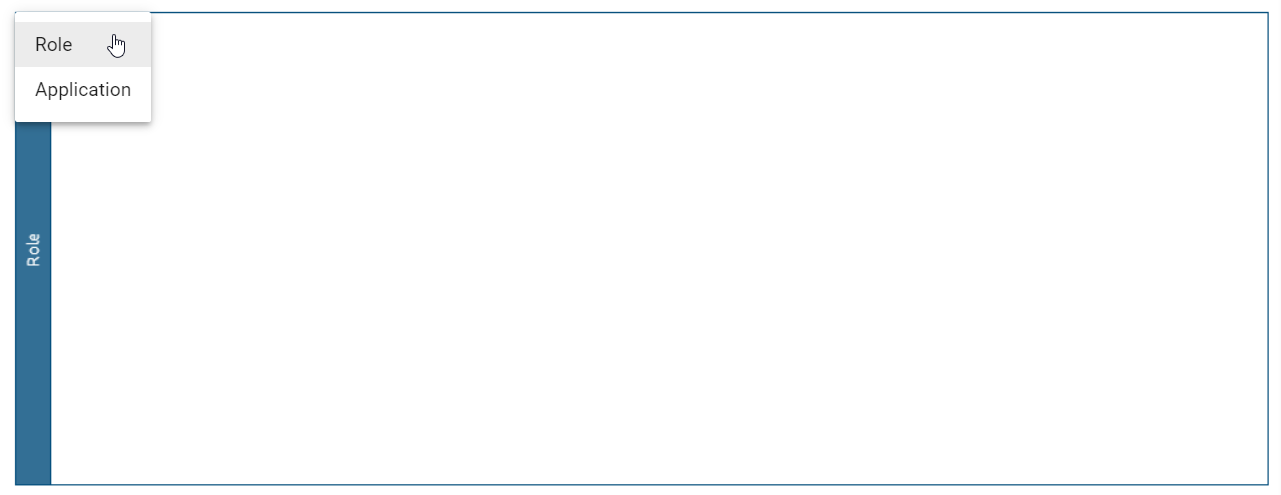
A selection menu for the pool opens. In this case, you may decide whether the pool will represent a Role or an Application. Please note that this decision can not be changed afterwards.
Create a lane:
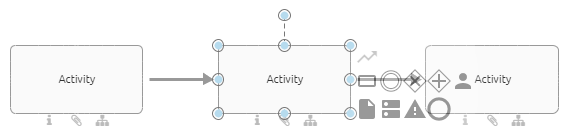
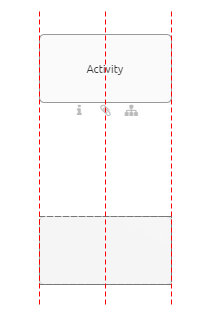
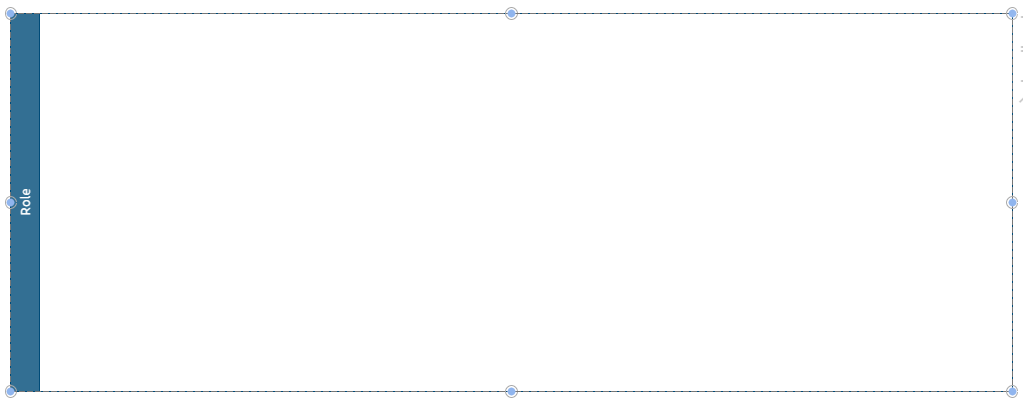
Select the pool located in the editor (a further subdivision of lanes can be made accordingly). There are some icons at the top right-hand side of the object.
If you click on the two horizontal strokes, two lanes are generated in the object.

Select a lane with a left-click. If you click on the arrow pointing upwards or downwards on a horizontal line, you can insert additional lanes above or below.


To change the position of the selected lane, click on the up or down arrow. The lane is moved up or down.

Note
A pool which is containing lanes can be selected by clicking on the blue header.
How do I change watermarks of pools and lanes?
Watermarks are visible by default in the background of pools and lanes. These watermarks are repeatedly shown from a certain width of the symbol and automatically display the name of the pool or lane in the selected content language. You can adjust the watermark yourself as follows.
Navigate to the format settings via the symbol palette by selecting the third icon on the symbols menu.
Select the pool or lane including the watermark you want to edit.
Select the menu button Form and open the entry Watermark. There you can remove the watermark by deselecting the checkbox Visible or you can rename the watermark and adjust it to your needs. Customization options include font size and color, as well as the location of the watermark within the pool or lane.
Note
If you rename the watermark itself in the symbol palette in the Text field, it will no longer initially display the name of the object. To have the name of the object automatically adopted again, you only have to remove your input in the symbol palette under Text or leave the input field empty.
How can I model inside and between pools?
As soon as you want to connect two pools, the connection type Message Flow is selected automatically. This applies also for connections between activities and connections between activities and events, which lie in different pools.

If those objects are connected within a pool the connection type Sequence will be selected automatically.
In addition, connections can be modeled using the mini symbol palette. When creating a new object from the mini symbol palette of an existing object that is in the pool, the following is considered: If the new object is placed outside the pool and not in another pool, the pool is automatically enlarged. Thus, the pool contains the new object, which is connected to the other object via the type Sequence. If the new object is stored within another pool, no connection is initially created. This can subsequently be modeled again as a Message Flow via the connection symbol.
Please note that the connection type does not change by moving an object from another pool into the pool of the connected entity. This may cause validation errors.
What kind of task types exist in a BPMN diagram?
You have the possibility to change the activity type of an activity in your BPMN diagram. This provides two advantages. Firstly, the selected activity type will be displayed with an icon, which makes your diagram more readable. Secondly, BIC Process Execution allows you to provide templates for the specific types that can reduce the workload of your users.
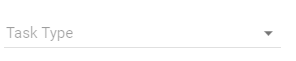
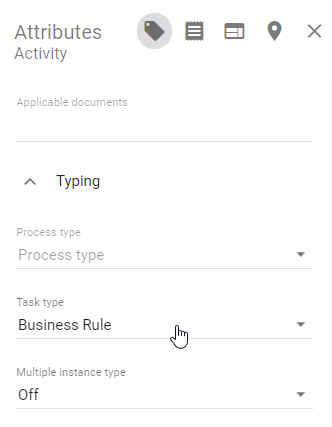
If you want to change the task type of an activity you need to select the corresponding activity first. After that go to its attributes.
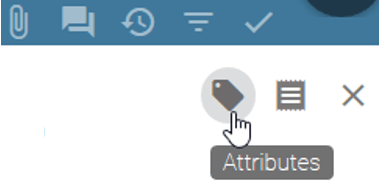
In the group Typing you can change the attribute Task type. To do that change the type as desired using a selection menu. It opens by a click on the marked arrow. The changes are also noticeable at the object itself through different icons that show up.
You can choose from the following options. But be aware that some template editors only work in combination with BIC Process Execution. Therefore your process must be marked as executable as well.
None: This is the default type for an activity. It does not allow the creation of any additional templates.
Send: This task type defines that an user has to send a message. BIC Process Execution allows the creation of an e-mail template and the automatic sending of emails. It is symbolized by a filled envelope.
Receive: This task type expects that your user will receive a message. It is symbolized by an envelope.
User: A user task is a task which will be executed by one of your users (if necessary with software support). BIC Process Execution allows the possibility to define own user forms, where a user can input or calculate values and get output values.
Manual: The task type manual is characterized by the fact that it must be performed manually by a user. Therefore, it has no form of integration with BIC Process Execution. It is symbolized by a hand.
Business Rule: A business rule allows you to define certain rules and conditions to calculate an output value or to set a variable to a certain value. This chapter gives you more details about how to use the DMN editor. This type is symbolized by a table.
Service: You can use a service task to use REST Calls in your process. This means you can integrate other software components or web services with BIC Process Execution. The symbol of this type is a gear.
Script: With the help of a script task you can include your own scripts so this process step can run automatically. It is symbolized by a computer chip.
Note
In addition to the Task type, you also have the option of further typing your activities using the attribute selection fields Process type and Multiple Instance Type. With the Process type for example you can define a call activity. Through the function of Multiple Instances Type, you can, for example, mark activities as parallel multiple instances.
How do I change the event type in a BPMN diagram?
Select the event whose event type you want to change.

Display the attributes.
In the Event type attribute field, you can change the type as desired using a selection menu. To do this, click on the marked arrow. The changes are also noticeable at the object itself through different icons that show up. There are different event types available for the start, intermediate and end event, according to the OMG standard.

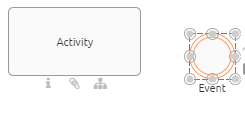
How do I attach an Intermediate Event to an Activity?
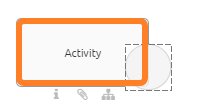
In BPMN diagrams you have the possibility to attach an intermediate event to an activity:
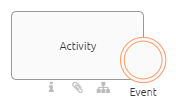
First, you need an activity. Then, drag & drop the intermediate event that you want to attach over the edge of the activity. The appearing orange edge means that you can attach the event to the activity. One half of the intermediate event is always placed inside the activity.
If you want to remove the intermediate event from the activity, simply drag & drop it back into the editor.
Note
When you move or change the size of the activity, the intermediate events remains attached to it.
DMN Editor
The DMN Editor gives you the option to add business rules to your diagram. Based on these rules, business processes can determine what action should be taken in different decision making situations.
Note
Decision tables can be created for objects of the type decision or for activities.
Where do I find the DMN Editor?
In the relevant diagram, navigate to the decision or activity for which you want to set rules. The object must have the task type Business Rule. You can find the Task type in the attribute group Typing within the attributes of the corresponding object.
To run the DMN editor open the context menu of the corresponding object with a right click on its symbol. Select the entry “Open DMN editor”.
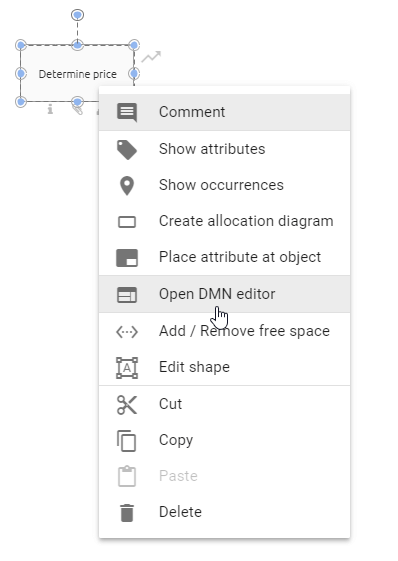
Alternatively, you can open the editor by selecting the activity and choosing Editor in the Details menu. There you will find the button Open Editor. Select it and the DMN editor will be opened.
The DMN editor opens in the form of a table. Here you can set and edit rules, input and output values. Alternatively, you can import whole decision tables. To get back to your diagram choose the option Save in the top right corner if you want to save your changes. If you do not want to save your changes select Cancel.
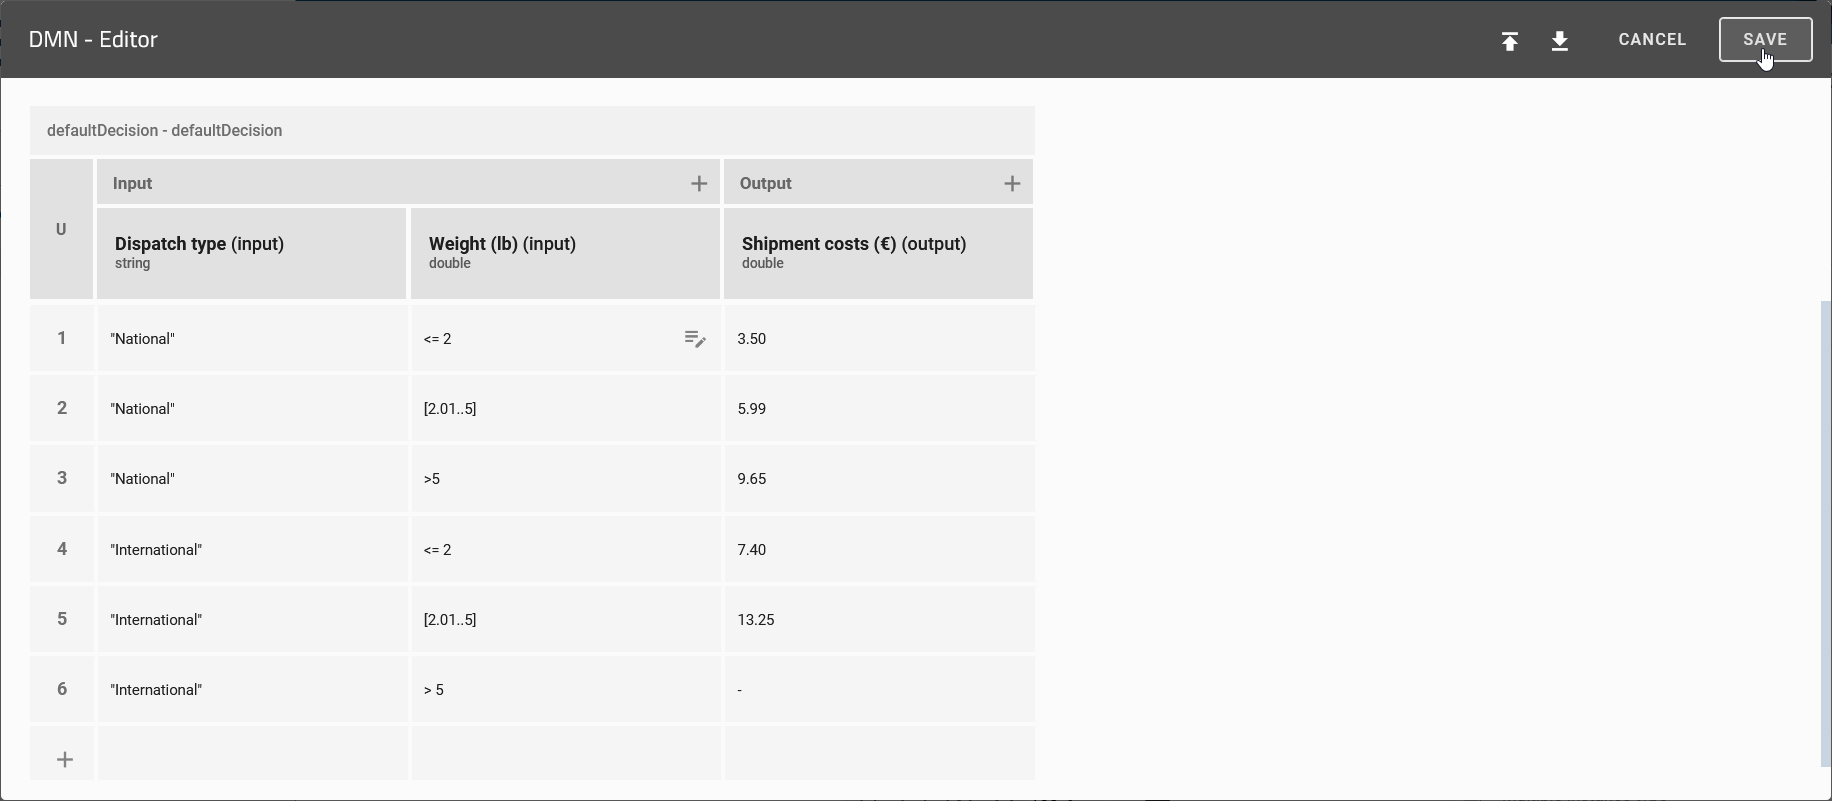
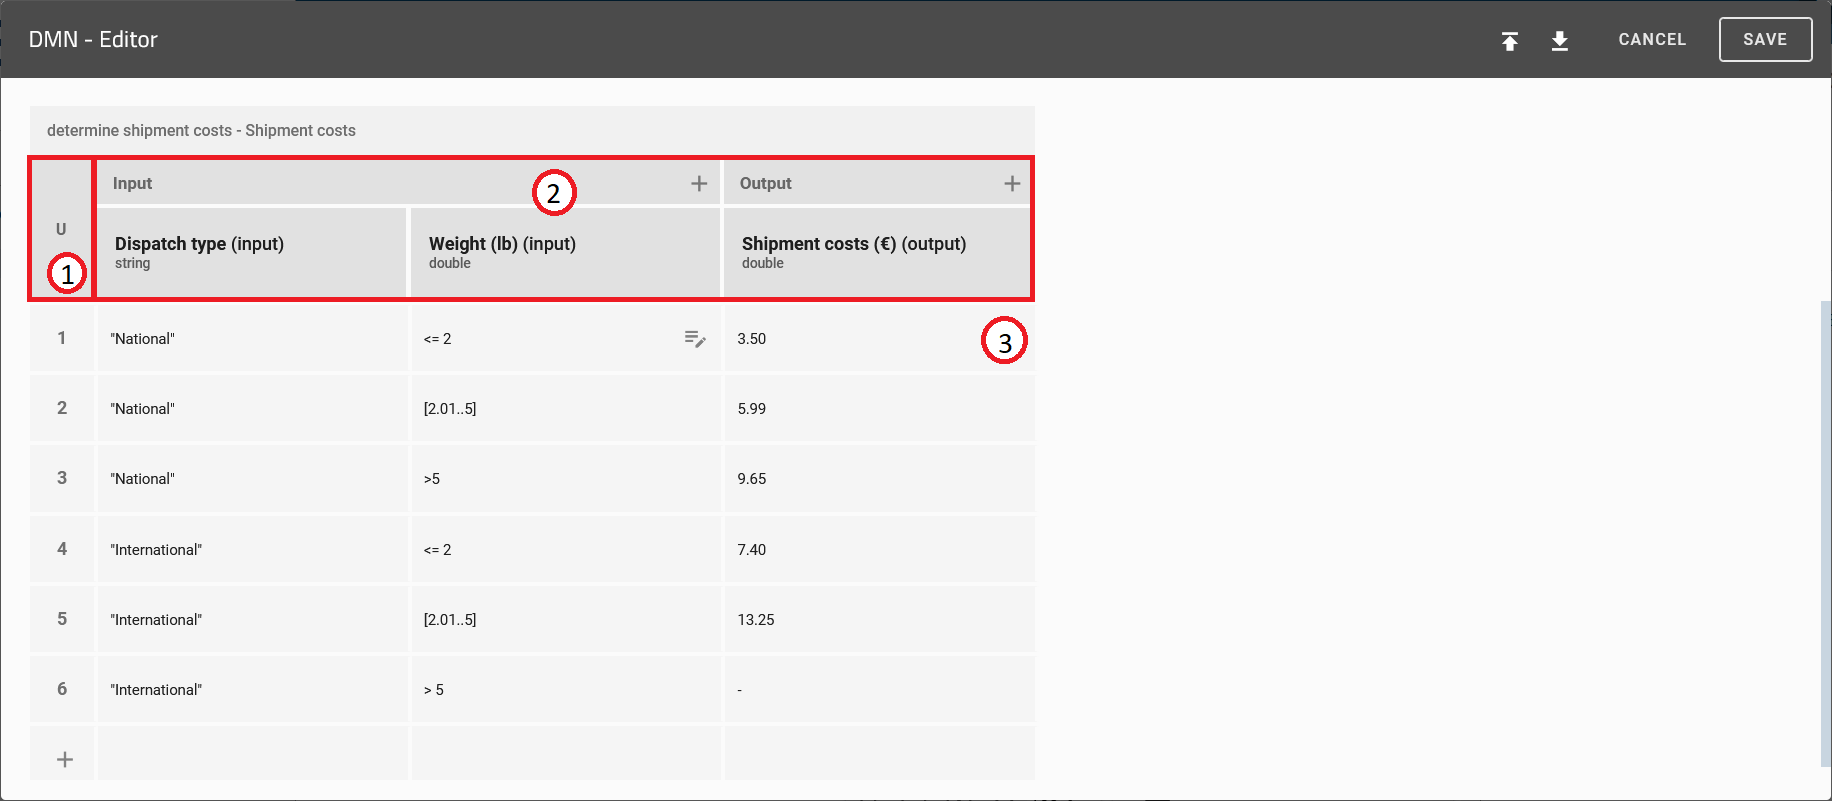
How is the DMN editor structured?
The available functions of the DMN editor are arranged within a table. The table can be divided into the following sections:
Hit Policy: Here you can see the selected hit policy.
Input/Output: The column Input includes all possible input values, which should be considered by the user. Analogously, the Output column returns the respective output values of the defined rules.
Rules: In this section you will find all decision rules, after which the respective decisions are later evaluated.
How can I change the selected hit policy?
With the help of the hit policy you can determine how your decision rules will be executed. You can change the policy with the following steps:
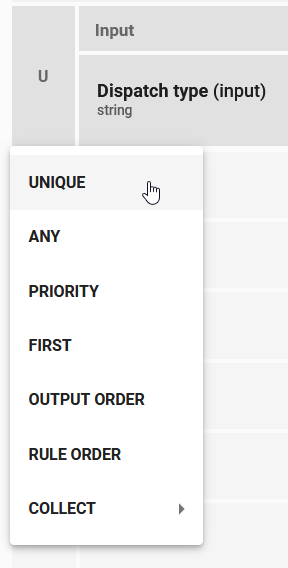
Navigate to the respecting business rule and open the DMN editor. Then, click on the field which displays the actual hit policy.
A list opens, that contains all available policies. Here you can select the desired hit policy.
Which hit policies exist and how can I use them?
With the DMN-Editor you can create rules that may overlap. Below you can see an example of that. Hit Policies are used to determine which output shall be returned.
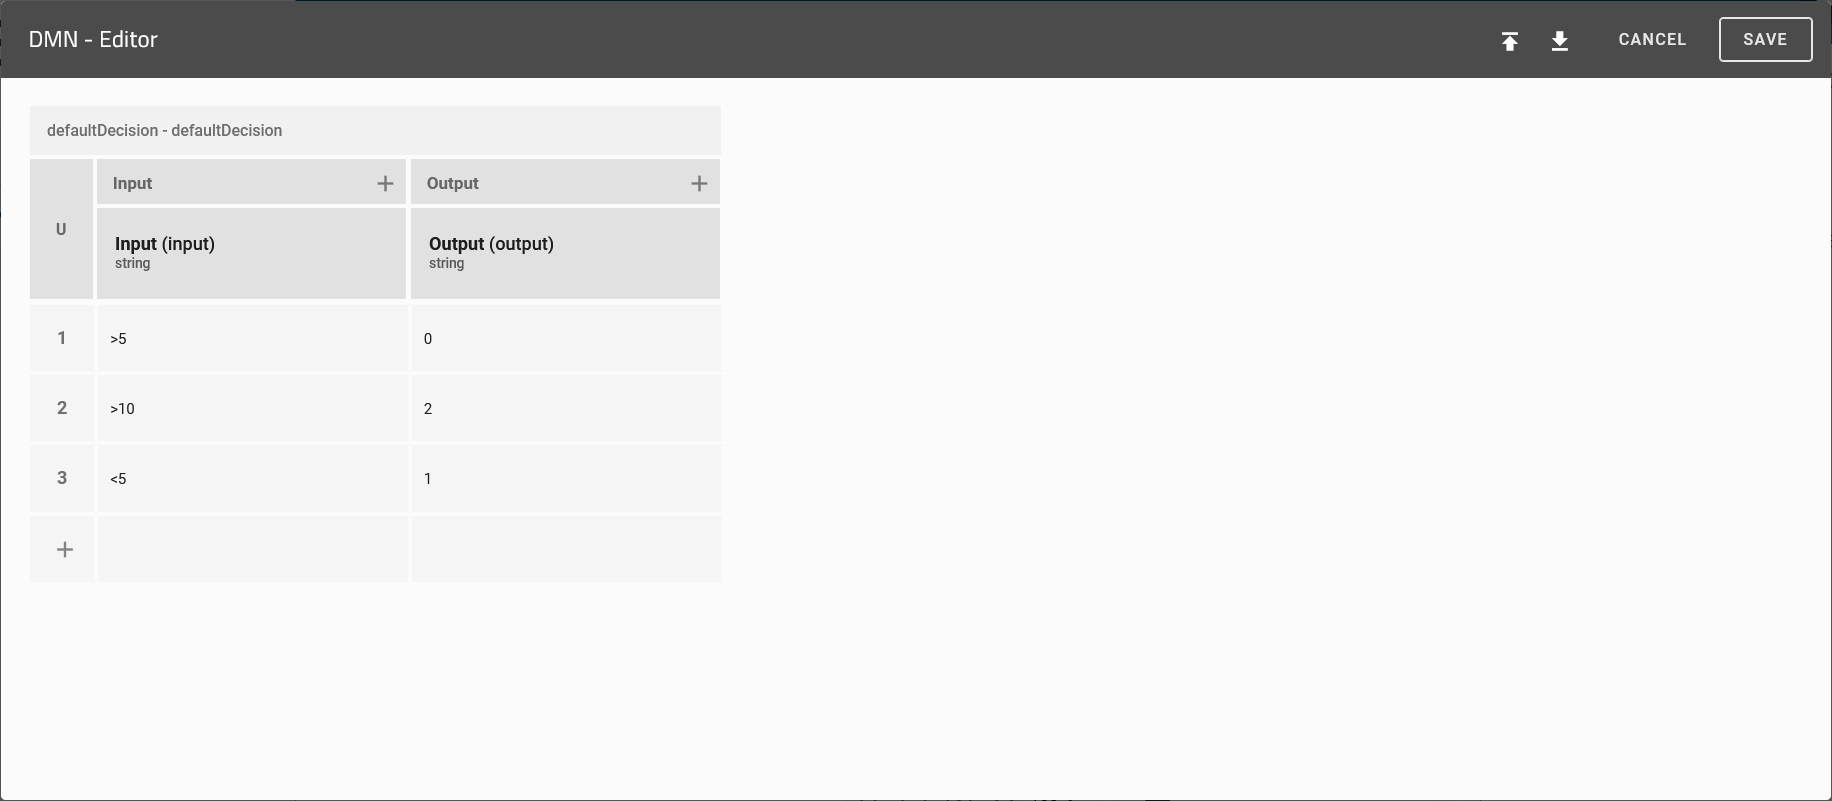
A distinction is made between hit policies that return only one value and those which can return multiple values.
If you want only one output out of your decision table, you can use the following hit policies.
UNIQUE: The rules are not allowed to overlap. Only a single rule can be matched and return its output.
ANY: Rules may overlap, but if they do they have the same output. Any match can be returned. If the outputs are not the same there will be an error while using the decision table.
PRIORITY: This hit policy is currently not supported.
FIRST: Rules may overlap. If they do, the first rule who matches returns its output. That means that the order of the rules in the DMN-Editor is important.
If you want to get more than one output, you can use the following hit policies.
OUTPUT ORDER: This hit policy is currently not supported.
RULE ORDER: All outputs of matched rules will be returned, in order of the rules in the DMN-Editor. That means that the order in the DMN-Editor is important.
COLLECT: All outputs of matched rules will be returned in an arbitrary order. Optionally, you can add an operator to manipulate your result:
no aggregation: All values will be returned.
sum: The sum of all numeric outputs will be returned.
min: The smallest value of all numeric outputs will be returned.
max: The biggest value of all numeric outputs will be returned.
count: The number of rules matched will be returned.
How do I add input and output values to my decision table?
If you want to use additional input or output values for your decision rules you can add them to your decision table by executing the following steps:
Open the DMN editor of the respecting activity.
Click on the plus button next to Input or Output, within the section “Input/Output” to add a new input or output value to your table. The new input/output value then appears in the corresponding column.

How can I edit the input values?
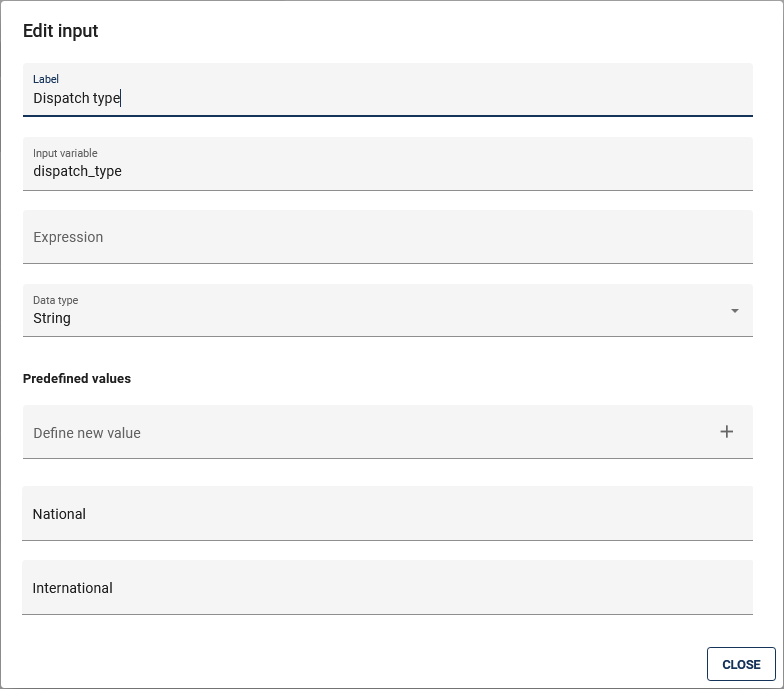
Within the decision table, the properties of your input values can be edited comprehensively for all decision rules. To change these properties open the DMN editor of the desired object and then click on the input value in the “Input/Output” section. A dialog box opens in which you can adjust the selected input value.
You can edit the following properties:
Label: Here you can specify the name under which the respective input value is displayed in the attributes of the object. If you do not specify a label, it gets automatically generated (e.g. Input1).
Input variable: As soon as you evaluate input values they are stored in variables. These should have a unique identification for further processing by the DMN engine. The identification is defined within the property Input variable. Be aware that for the value of the Input variable only a combination of the following characters is allowed: lower- and uppercase letters, underscores and numbers. Numbers are only allowed as subsequent characters. If no value has been set it is automatically generated by the DMN editor. This generated value is based on the given value set in the property Input label. You also can use pre defined process variables here.
Expression: This property allows you to define expressions for each input value. As a result, the input values of the decision rules can be additionally specified and changed.
Data type: With the drop-down menu you can specify the data type for the respective input value. You can choose from the following data types: string, boolean, integer, long, double and date.
Predefined values: You have the following options for input values of type String: Enter strings in the Define new value field and add them to the list of predefined values using the plus icon. Existing list entries can be deleted via the corresponding trashcan icon. Finally, this list serves as a suggestion list for possible input values for the evaluation of the decision. The predefined values can therefore reflect the cells entered in the section “Rules” for the respective input. Be aware that this list is only a suggestion list. Users can still enter different input.
After you have completed your changes, you can save them by clicking the CLOSE button.
Note
You can use the variables defined here in other activities, e.g. as a process variables in BIC Process Execution.
How can I edit the output values?
Within the decision table, the properties of your output values can be edited comprehensively for all decision rules. To change these properties open the DMN editor of the desired object and then click on the output value in the “Input/Output” section. A dialog box opens in which you can adjust the selected output value.
You can edit the following properties:
Label: Here you can specify the name under which the respective output value is displayed in the attributes of the object after the evaluation of the input values.
Output variable: As soon as you evaluate the decision rules, the output values are stored in variables. These should have a unique identification for further processing by the DMN engine.
Data type: With the drop-down menu you can specify the data type for the respective output value. You have the option to choose between the following data types: String, Boolean, Integer, Long, Double und Date.
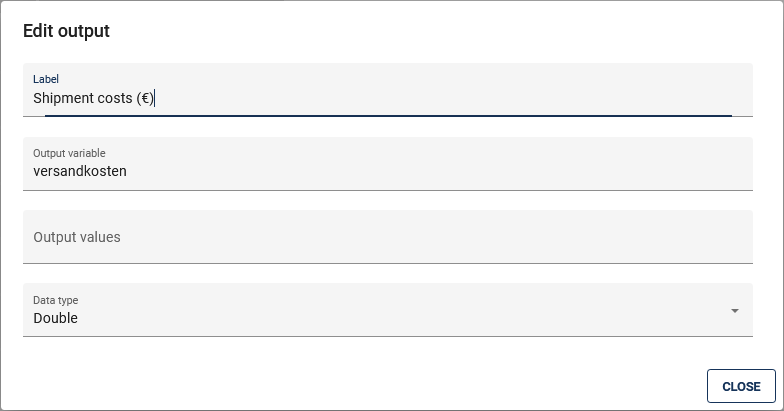
After you have completed your changes, you can save them by clicking the SAVE button. Click the button CANCEL to discard your changes.
Note
Possible functions of the property Output Values are currently not supported.
How do I delete input and output values from my decision table?
To remove an input or output value, execute the following steps:
Open the DMN editor of the respective activity. Choose the Option Delete column in the column you want to delete. This option is displayed with a trashcan-icon.
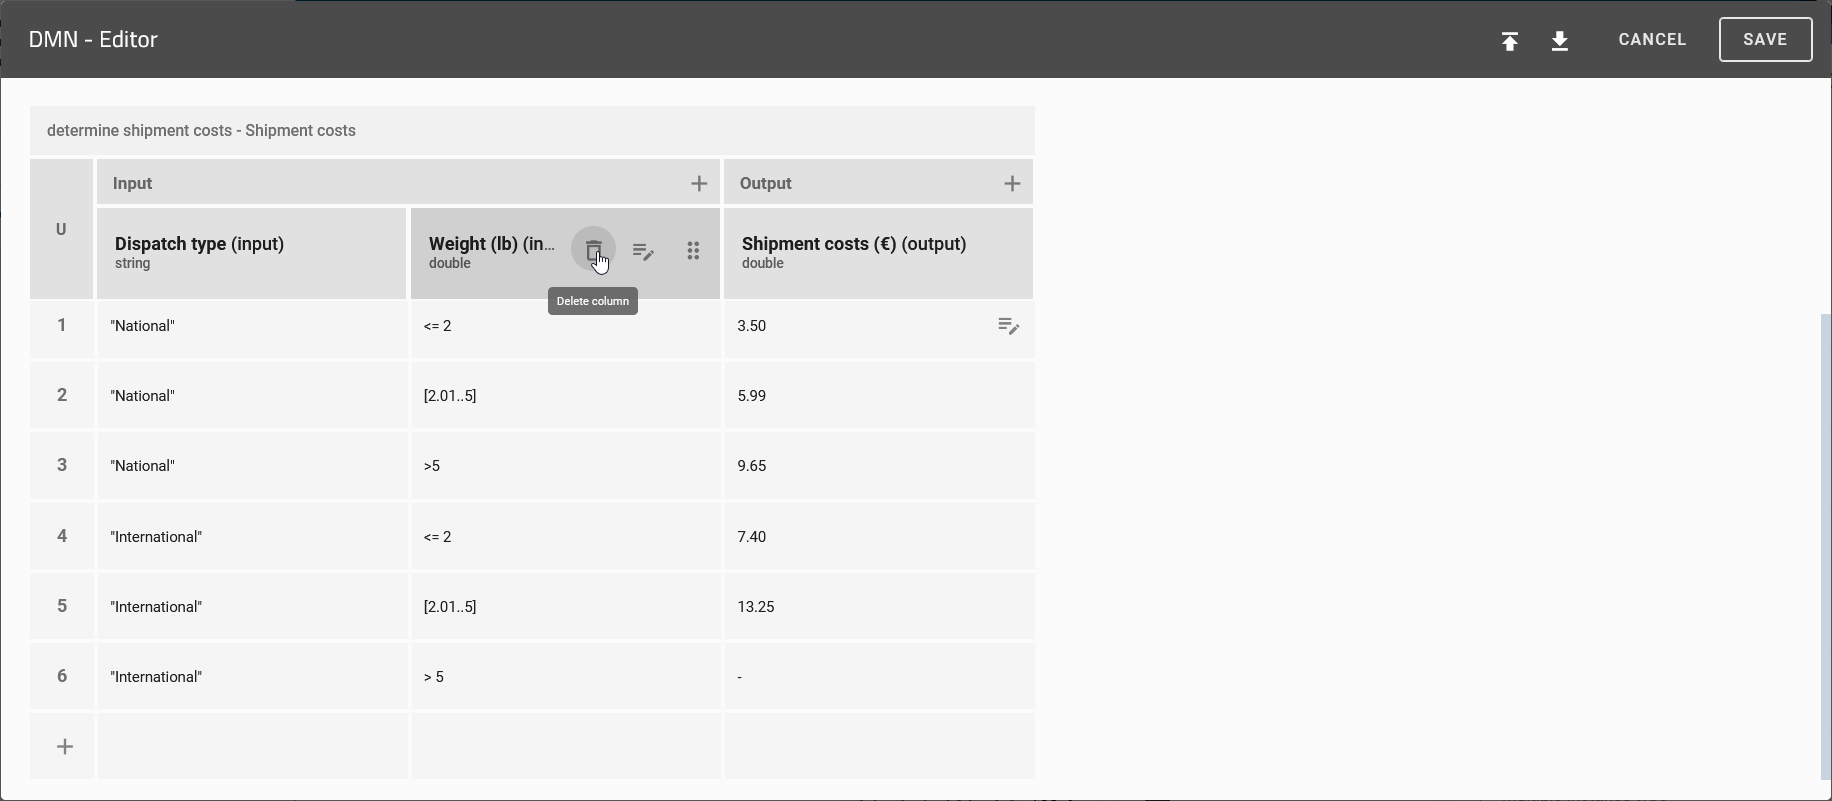
Note
Note that there must always be at least one input or output value for each decision table. If, for example, there is only one input value, it cannot be removed from the table.
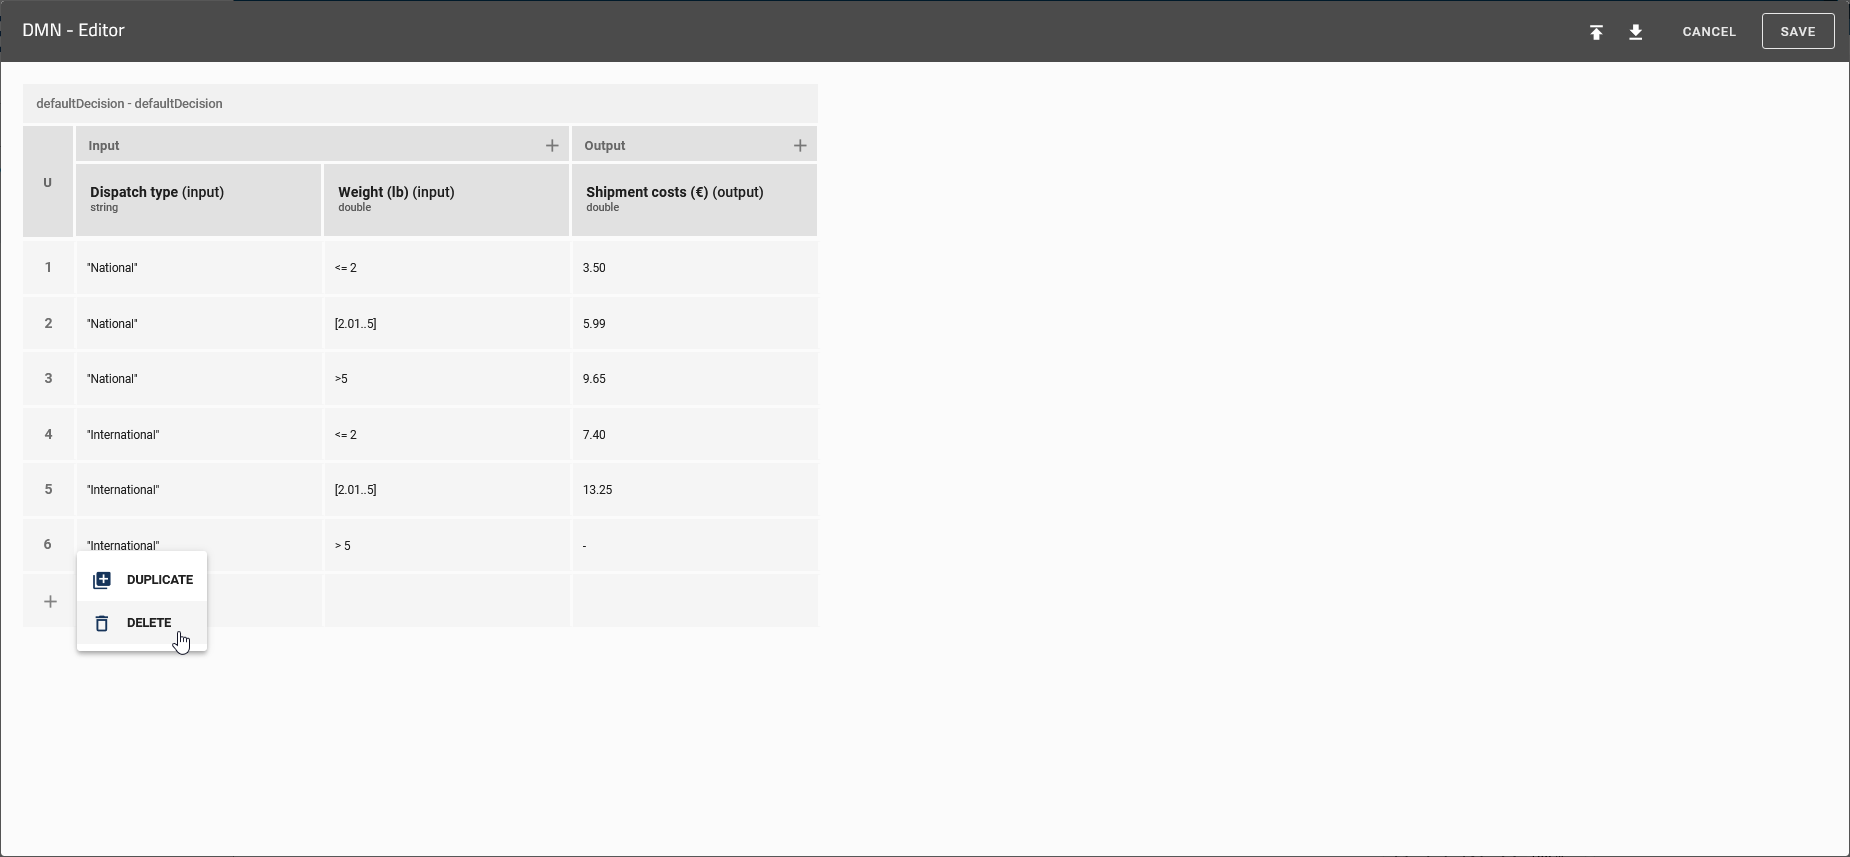
How do I administrate my decision rules?
Within the section “Rules” of the DMN editor you will find all decision rules for this decision. Every row represents a rule. It is defined by the specified input and output values. You can change these values with a click on the cell, that contains the value you want to change.
You can use the following functions to administrate the the decision rules:
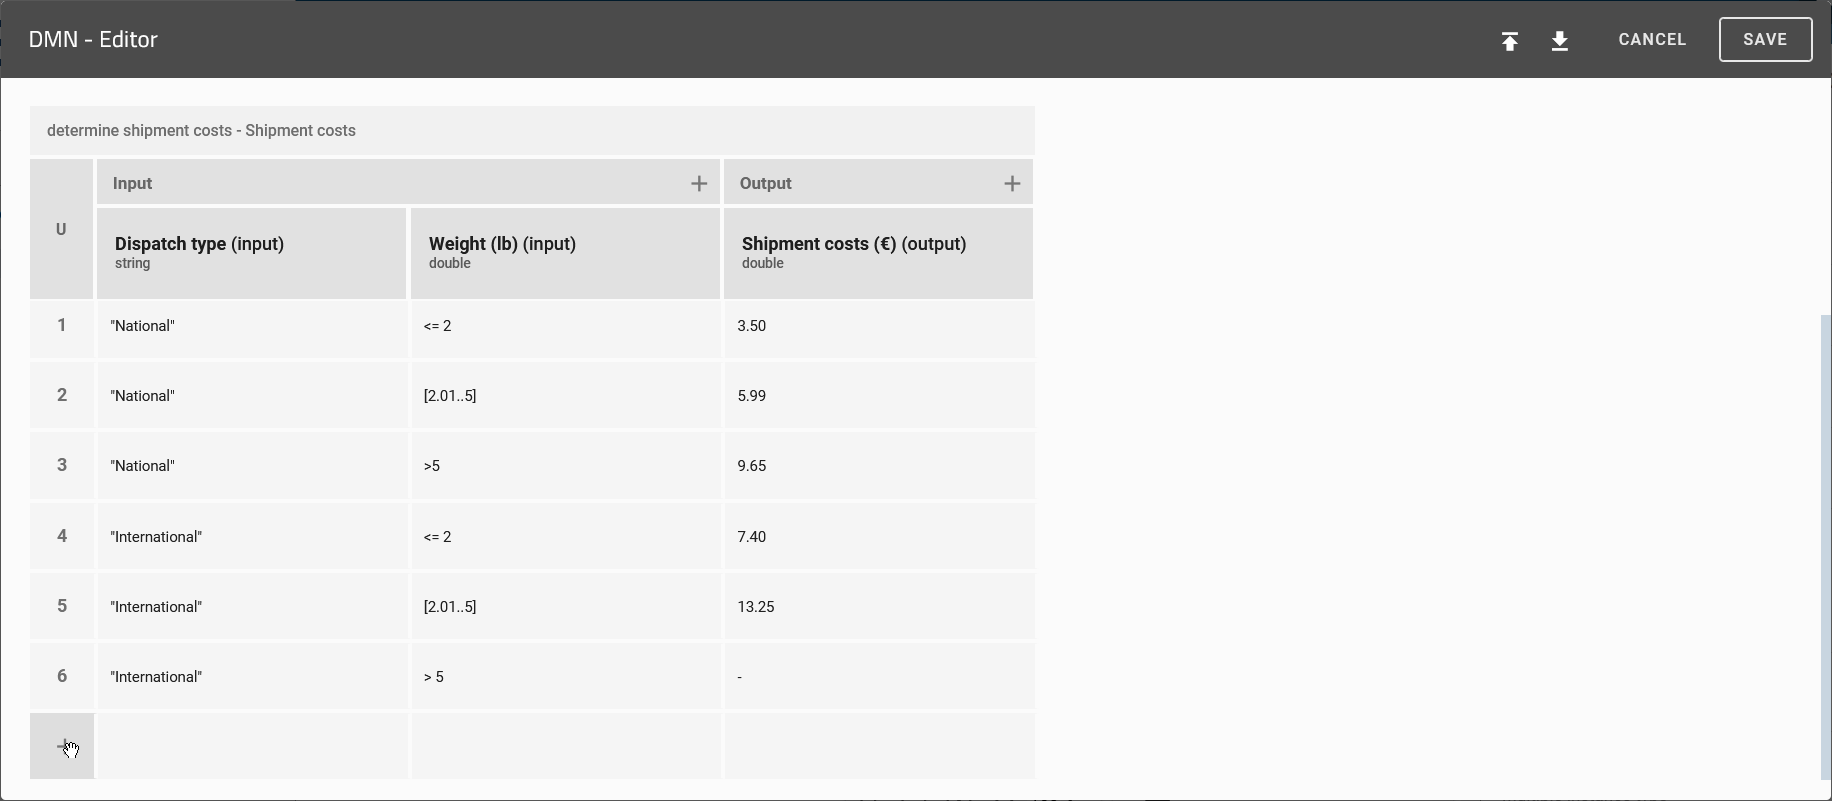
Add row
Through a click on the plus symbol under the last row you can add a new rule to your table.
Duplicate row
For easier handling, you can also duplicate entire rows. To do so, click on the number of the rule you want to duplicate, then select the option Duplicate from the context menu.
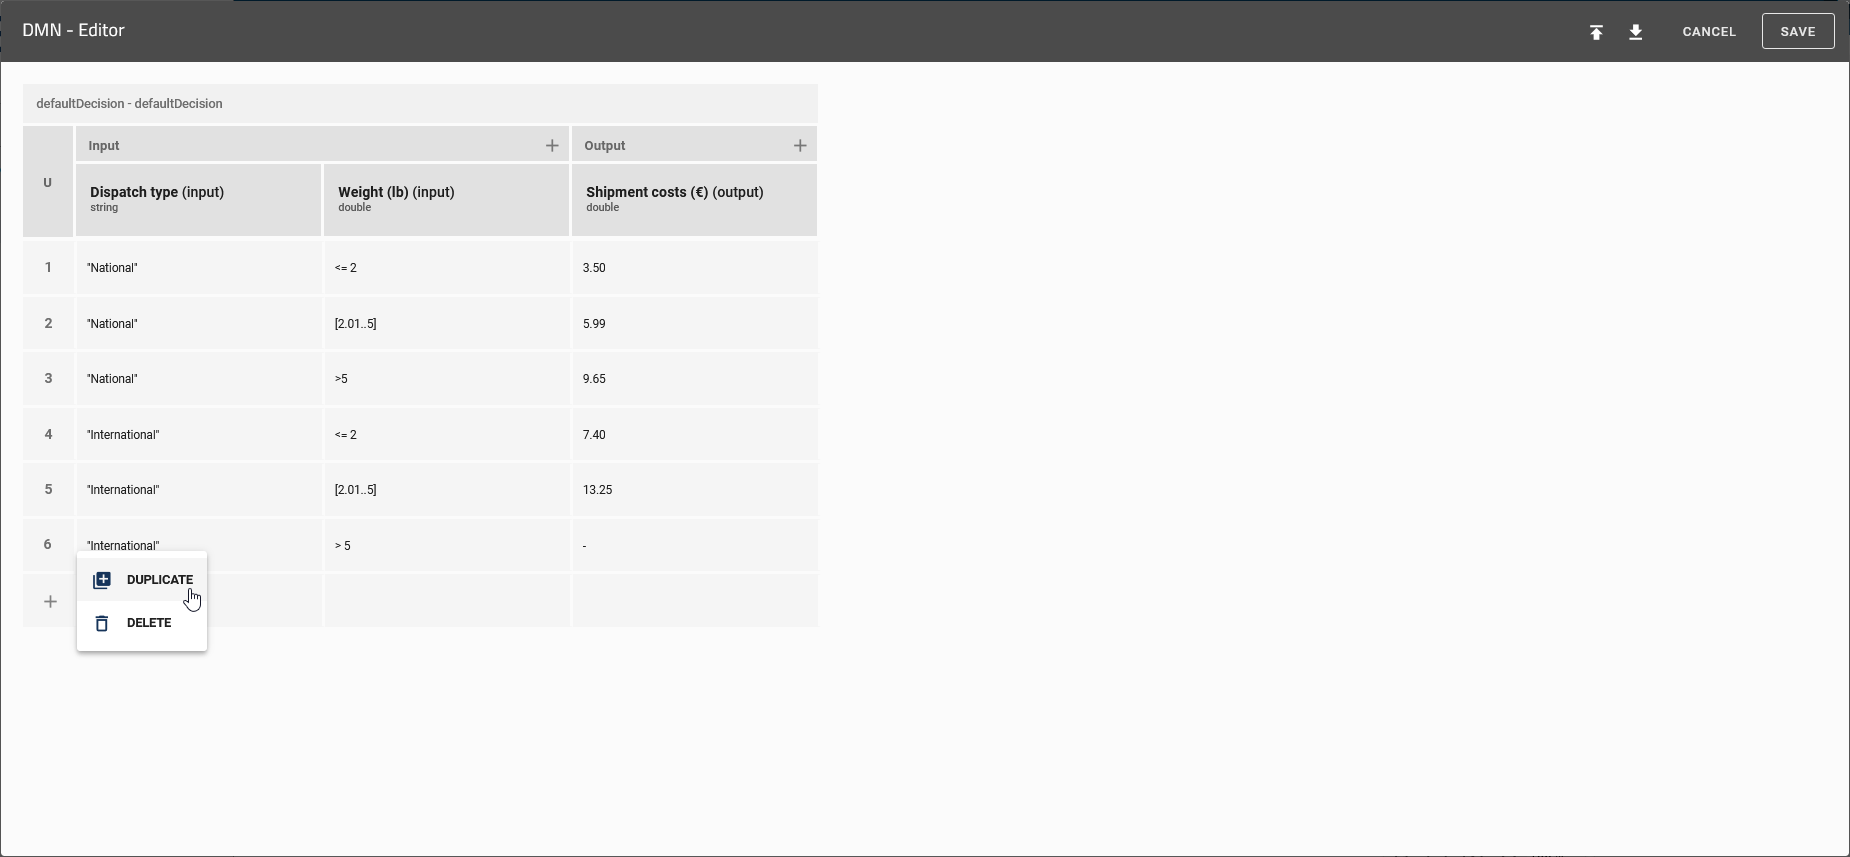
After that, a new rule will be created under the selected row. The new rule has the same values as the selected one.
Delete row
To delete a rule, click on the number of the respecting row and select the option Delete in the context menu. The line then disappears from the table.
Note
The semantics of the defined values are based on the DMN standard FEEL (“Friendly Enough Expression Language”).
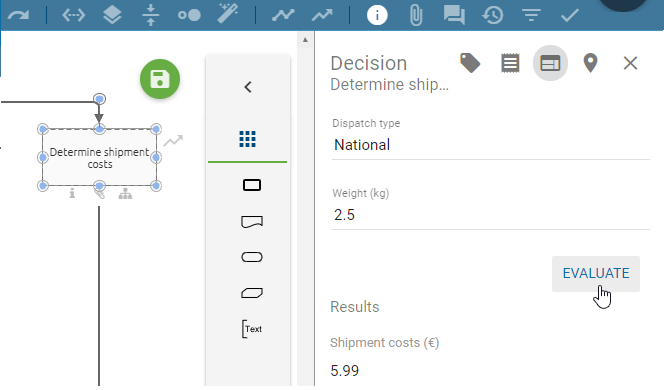
Where can I use the decision tables?
To use a decision table, navigate to the details of the respecting object and click on the Decision icon.
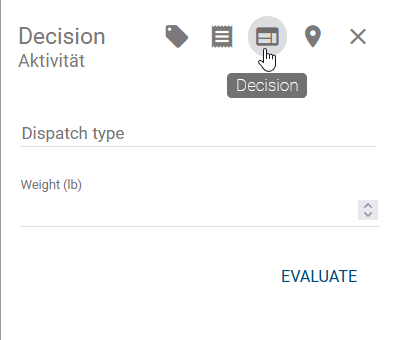
Here you can specify the specific input values. If predefined values have been maintained previously, a suggestion list appears when clicking on the respective input field. Click on Evaluate to start the evaluation. The results will then be displayed below the input values.
Note
When entering the values within a text field, pay attention to the capitalization!
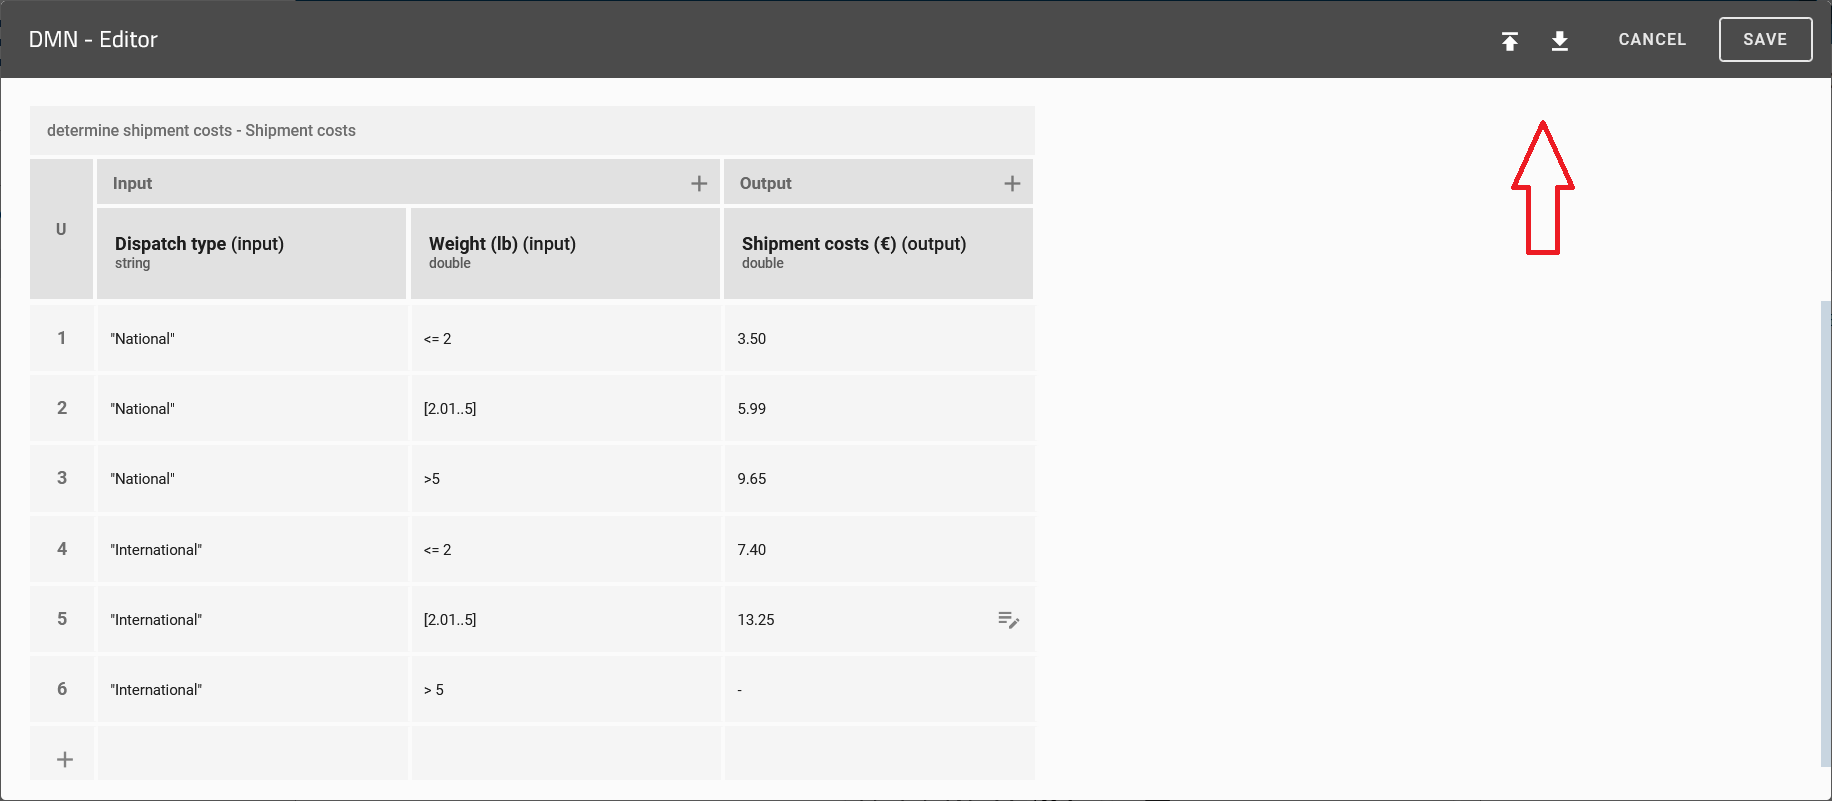
How can I import/export decision tables?
Using the DMN editor, you can import existing DMN tables or export DMN tables from BIC Process Design. Both options are explained below. Open the DMN editor of the activity
Choose the option Import or Export.
Import
If you select the Import option, a dialog box opens in which you can select the desired file. By clicking on Open the file will be imported afterwards.
Note
Note that the file, which should be imported, must be a .dmn file.
Export
Select the option Export. Your table will be exported as a .dmn file ans automatically downloaded.
Validation
How can I validate my modeling?
You can determine whether your modeling is valid for the settings selected by the administrator. To do this, open the Validation tab from the menu bar.
During modeling, you can display messages about validation errors in the diagram in the validation tab. When you Save the modeling or reopen the validation bar, it is updated.
At check-in, the consistency check is automatically activated. A note informs you about OCL rule violations that prevent check-in (severity blocker) and existing catalog suggestions in the modeling that are not allowed. With a click on Ok you can display these in the validation bar. Further validation errors are not automatically reported during check-in.
In both cases, you can see a list of unapproved or not published catalog entries regarding this diagram or entities for which check-in is prohibited in the right sidebar. If OCL rule violations or invalid sequence flows are existing in the diagram, the corresponding list is displayed here, too. In addition, catalog entries will be displayed if their Valid to date is reached. In the diagram, when clicking on a list entry, the associated symbols are highlighted in color. Furthermore, you can collapse the lists by clicking on the list header, which also shows the number of entries. At the top right you can Close the validation bar.
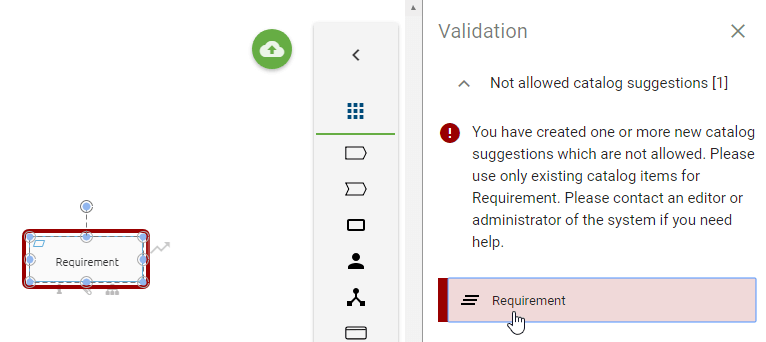
How do I handle not allowed catalog suggestions?
As long as some inadmissibility is displayed in the validation list Not allowed catalog suggestions, you will be not able to check in the diagram. The affected symbols that are additionally marked red in the validation should therefore be linked to an existing catalog entry via the suggestion list. If no suitable catalog entry exists, you can remove the symbol from the diagram. On the other hand, users can create a suitable new catalog entry with the rights of an editor. As soon as no more inadmissibility exists after saving, check-in is possible.
Note
Users who have the appropriate permissions can still create objects in the catalog for reuse in diagrams.
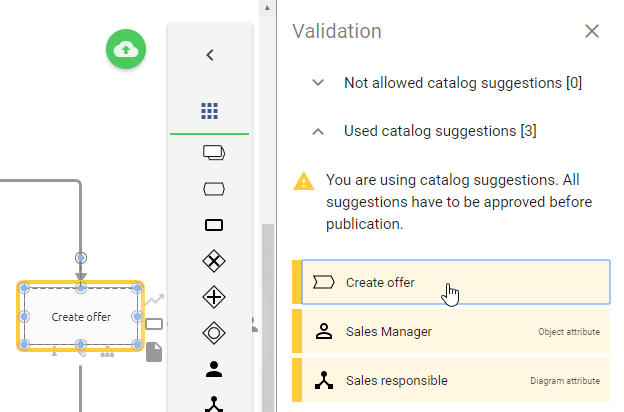
How do I deal with unapproved catalog suggestions?
In the validation you can see the list Used catalog suggestions. Entities in the opened diagram are listed here if they are not yet accepted in the catalog. This applies to newly created, existing symbols or symbols that are linked to catalog entries via attributes. When the validation bar is open, modeled entities are listed in yellow and marked in the editor by clicking on the entry. Entities, that are accepted in the catalog but are linked to unaccepted entities in the attributes, are also marked. It is indicated by the addition Object attribute in the list entry. If this behavior also occurs in the diagram attributes, the listed entity is labeled with Diagram attribute.
Check-in is not restricted by this feature. However, before publishing the diagram, the catalog suggestions listed here should be approved in the catalog of the public workspace. Otherwise publication is not possible and by starting the workflow, the initiator receives a corresponding message in the application. Users which have editor rights are able to approve those entries within the catalog or directly in the validation.
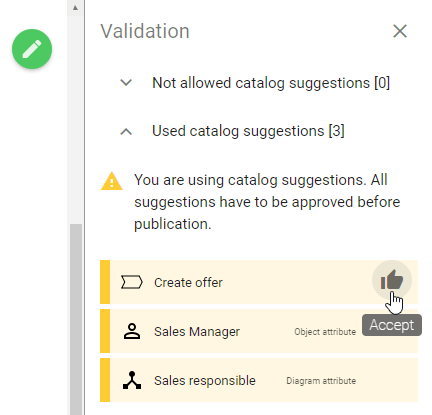
The diagram has to be checked in to approve these entries in the validation. If you then move the cursor over the respective entry, the Accept button appears to the right of the entry’s name. By clicking that button, the proposed catalog entry will be automatically accepted.
Note
Entries referring to objects or attributes within an allocation diagram will not automatically open this diagram after being clicked on. Open the allocation diagram to see the corresponding selection.
How do I deal with unpublished catalog suggestions?
In the validation, you can see the list of Not published catalog items. Entities of the selected diagram are listed here if they have their own responsible person (lifecycle) but have not yet been published.
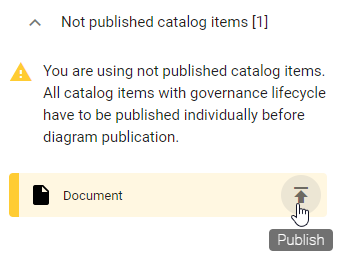
This applies to newly created, existing symbols or symbols that are linked to catalog entries via attributes. When the validation bar is open, modeled entities are listed in yellow and marked in the editor by clicking on the entry. Entities, that are linked to not published entities in the attributes, are also marked.
The user receives a corresponding message concerning unpublished catalog entries when initializing the publication of the diagram. The diagram can therefore only be published once all contained catalog entries with their own life cycle have already been published or the publishing process has been initiated. If a catalog entry is already in the preview stage but has not been published yet, a draft version of this entity is created in the published diagram. This draft version only contains the name and access restrictions of the entity. Once the catalog entry is published, the draft version is replaced by the correct version.
Users with author rights can publish the catalog entries in the catalog or directly in the validation tab. To start the publication directly, the diagram must be checked in. Use the mouse to navigate to the list entry so that the Publish button appears next to its name. You can initiate the workflow as usual by clicking this button.
How are OCL rule violations displayed?
The OCL (Object Constraint Language) is supported on the method side and is also used for validating the model. This allows you to set various modeling restrictions that help users to design valid diagrams. Rules defined with OCL for modeling are checked during modeling and/ or afterwards (during check-in). Rule violations are displayed in the validation mode and can be defined in the method with appropriate notes for the modeler. Both connected and unconnected modeling objects can be validated. By clicking on the list entry in the validation, the corresponding object is marked in the diagram.
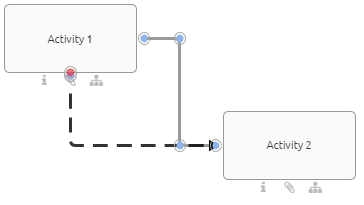
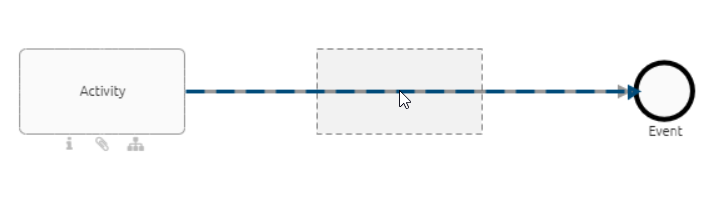
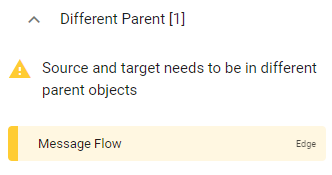
This is for example used in BPMN Collaboration diagrams to prevent invalid message flows. In this case, a message flow was modeled between two objects that are placed in the same pool. This is not permitted here by the method and is displayed as follows in the validation.
Moreover, OCL rules concerning diagram attributes, so called semantic checks, can be defined in the method. Depending on the setting, the check is done when the diagram is modeled or when it is checked-in. For example, semantic checks can be useful to ensure that modellers always maintain a specific diagram attribute or set a meaningful validity period. If you model a diagram and a semantic check fails for a diagram attribute, you will be informed about it in the validation hub. The hint is - depending on the concerning method setting - either a warning (yellow), an error (red) or a blocker. If a modeled diagram violates a blocker, the check-in is not possible. You need to correct the modeling to be able to transfer the diagram from your local storage to the public workspace via the check-in.
Hint
Please be aware that users who utilize customized OCL rules do not receive the diagram attribute checks automatically. They need to integrate these manually into their customized method.
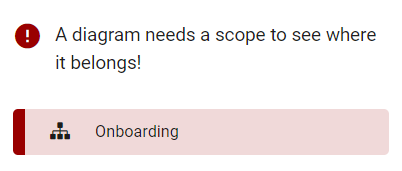
In the method of the following example, a rule has been defined which states that the attribute scope (AT_SCOPE) of a BPMN diagram has to be maintained. In case of a violation, a customized message will be shown. A violation of this rule is estimated as an error. Thus, the following error hint is displayed to the modeller of the diagram “Onboarding” because the scope attribute is empty.
OCL rules can be adjusted in customizing.
How is an invalid sequence flow displayed?
In the validation of BPMN diagrams, objects with invalid sequence flows are listed under the heading Sequence flow, if these exist in your modeling. In the following cases you will receive a corresponding note in the validation bar:
Intermediate events have no incoming and/or outgoing sequence flow
Activities have no incoming and/or outgoing sequence flow
Start events have no or more outgoing sequences
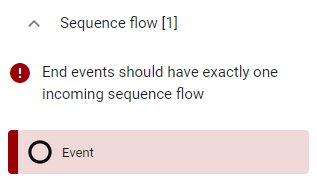
End events have no or several incoming sequences
Gateways have several incoming and outgoing sequence flows simultaneously
Gateways have exactly one incoming and one outgoing sequence flow
As an example, the message for an end event without an incoming sequence is displayed here.
Allocation diagrams
Allocation diagrams allow you to add subgraphs to the main graph of your diagram. By using these allocation diagrams you can model subdiagrams in a manner, so that your main diagram is not overloaded with details.
Note
Allocation diagrams can only be created for activities because the resources used in this activity are represented in this diagram type. A diagram can contain multiple allocation diagrams, depending on the number of existing activities. To create or edit an allocation diagram, the diagram in which the activity is located must be checked out.
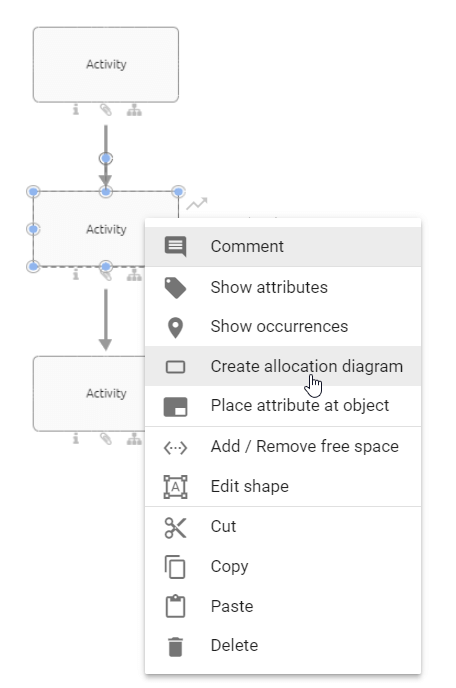
How can I create a new allocation diagram?
Open the context menu of the corresponding activity by right-clicking on the symbol. Select the option Create allocation diagram.
You will get to the editor of the allocation diagram where you will find the symbol of the respecting activity. Within this editor you can now model as usual.
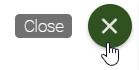
If you want to return to your main diagram click on the Close button on the upper right corner of your editor. When changes have been made you must save first before you can use the Close function. You will then see the main diagram at the same position with the same zoom settings as before and the corresponding activity is selected.
Note
Only one allocation diagram can be created per activity, as this ensures a clear assignment.
How can I edit an allocation diagram?
To open an allocation diagram for editing you have two possibilities:
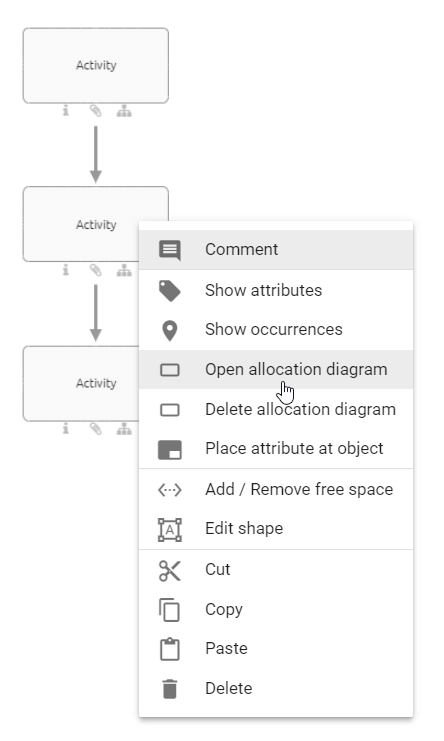
Navigate to the diagram in which the associated allocation diagram is located. Open the context menu of the corresponding activity by right-clicking on the symbol. Select the option Open allocation diagram.
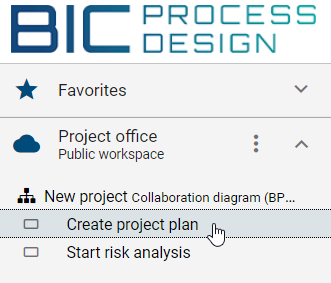
Navigate to the diagram in which the associated allocation diagram is located. In the explorer you can find all associated allocation diagrams subordinated to the respecting diagram.
To apply the changes, click on the Save button on the upper right corner of your editor after editing your allocation diagram.
Note
Symbols created in the allocation diagram are only displayed there. Changes you make to the activity for which the allocation diagram was created are visible in the main diagram and also in the corresponding allocation diagram. It does not matter if the changes have been made in the main graph or the allocation diagram itself, or if there is a catalog entry for this activity. Note that it is not possible to edit an activity with an allocation diagram using the suggestion list.
How can an allocation diagram be deleted?
To delete an allocation diagram execute the following steps:
Navigate to the diagram in which the the associated allocation diagram is located. Then, open the context menu of the corresponding activity by right-clicking on the symbol. Select the option Delete allocation diagram.
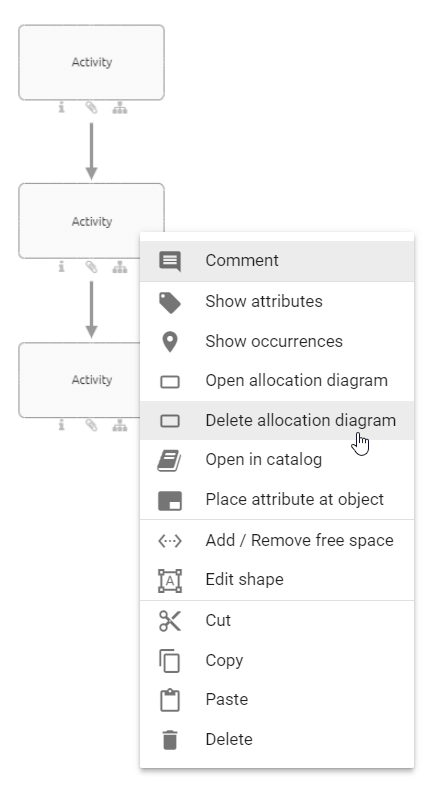
The allocation diagram has been removed and is no longer displayed in the explorer under the corresponding diagram.
Where do I see the allocation diagram’s information?
Allocation diagrams belong always to the diagrams, where they were created in. This means that all information of the allocation diagrams, which are important for the context of the main diagram, are also displayed at the respecting places. Such information are mainly objects and their associations and attributes. So places where they will be included are for example the available exports, the different diagram views and the profile.
Note
In some reports illustrations of diagrams are displayed, here only the main graph is shown.
What are external function allocation diagrams (FAD) and how can I use them?
External function allocation diagrams (FAD) are analogous to allocation diagrams diagrams, which you can allocate to activities in order to describe a subordinated part of your diagram more precisely. Unlike the allocation diagrams, external FADs are not created via the context menu of an activity. An external FAD is an already existing diagram which is assigned to another activity in another diagram using the Allocation model attribute.
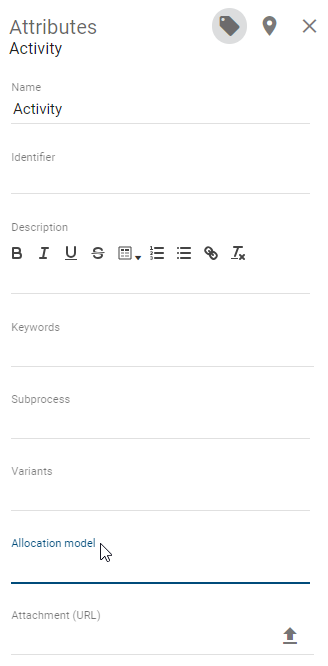
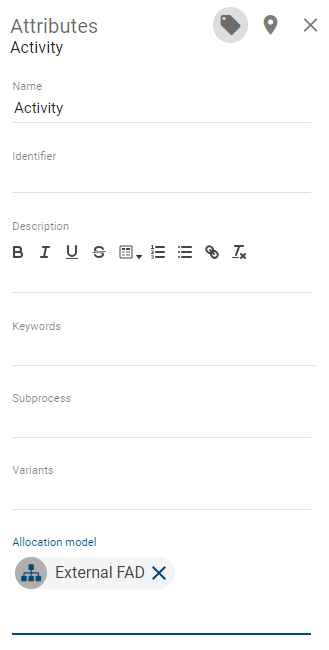
Analogous to the subprocess, simply link a diagram to an activity within its attribute Allocation model in order to assign the diagram to the activity as an external FAD.
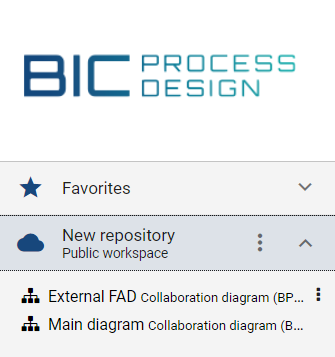
The external FAD continues to exist as an independent diagram, which can also be seen from the arrangement in the repository.
However, analogous to the allocation diagram, all relevant objects of the external FAD are also listed in the reports of the diagram that contains the relevant activity with the assigned FAD. In addition, by simply clicking on the external FAD in the activity’s attributes, you are automatically directed to the relevant diagram.
Note
Only one FAD can be created per activity, as this ensures a clear assignment.
Note
Please note that in the old UI unlike allocation diagrams, objects from the external FADs, are not listed in the different diagram views, e.g. the Matrix. In the new UI however, these are also listed in the diagram views.
Hint
Please note that diagrams accessed through a shared link can also be viewed by users who do not have read permission for that stage. In addition, limited navigation to other linked diagrams (e.g., subprocess, variants) is possible.