Exports
How can I print a diagram?
Open the intended diagram in the desired stage. In the menu bar above the opened diagram you will find the Print preview button. Click on this button to open the print menu on the left side.

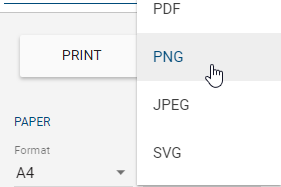
From the drop-down menu, first select the format in which you want to save and print the diagram. You can choose between PDF, PNG, JPEG and SVG formats.
Note
Please note that SVG files do not support embedded fonts. The icons are based on the Material Icons and Font Awesome fonts and can only be displayed correctly if these fonts are installed on your host system. Otherwise, the missing icons will be displayed as rectangles, which is not a bug, but due to the SVG format. Our application includes all the necessary fonts to display SVG files correctly. However, if you need print output with embedded fonts, we recommend that you create a PDF file, as it contains all the necessary fonts for correct display.
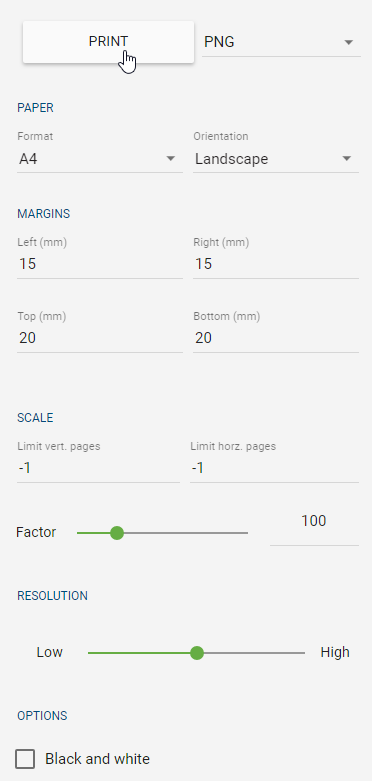
Some presets can be made by the administrator or modeler. In the print menu, you can set the following and adjust the print as you like:
Select the paper size
Set the orientation
Define or reset page margins
Set the scale
Set resolution (png, jpeg only)
Display header and footer in file (not visible in print preview and configured via administration, only pdf)
Print black and white
Once you have made the desired settings, you can print or export the diagram by clicking the Print-button. For security reasons it is not possible to send a print job directly from your browser to your printer. Your diagram is then exported with the selected settings and in the desired format in your content language. You can open the export and print it using the relevant program, such as the PDF reader.
You can leave the print preview via the Back to process view-arrow in the menu bar. The print settings are not saved. Modelers can make some print presets instead.
Note
The print preview does not support files stored in interlace mode in the diagram, such as PNG files. In this case, you can save the file without interlacing and reinsert it into the diagram.
Note
Please note that not all fonts support cyrillic letters in the PDF print. The letters will not be displayed in the PDF if the font Handlee, Inconsolata or Titillium Web is used. In case of the fonts Arial, Courier New, Georgia, Lucida, Palatino, Tahoma, Times New Roman, TrebuchetMS and Verdana, cyrillic letters will be shown in the default font Ubuntu. Currently arabic letters are not supported in a PDF print at all.
Note
If the formatting bold/italic is used in combination with the font Handlee or Ubuntu Condensed, it is not applied to the PDF print. The fonts Inconsolata, Open Sans Condensed and Roboto Slab do not support italic formatting in the PDF print as well.
Note
If you open an SVG export in your local operating system, the used fonts for text and symbols (GF and FA) must be installed there.
How can I export data?
Creating reports
You can only export checked-in diagrams. Therefore, make sure in which area you are located and, if necessary, change it via the corresponding menu.
Select a diagram, category or a repository for which you want to create an export. There, click the Download report-button and select an entry (e.g. Manual).

At the bottom right of the screen, you will get for example the information Report is being created and afterwards the Report has been created message. Click on the download link to download the export.
Now you can open the created export. This contains extensive information about your diagram. A list of available exports can be found in the following chapter.
Note
The report language is always based on your current content language.
Data backup
To save data, administrators can export diagrams, categories, and repositories. The exports are stage-dependent and can be executed in Public workspace, Preview and Publication. When exporting in the public workspace, note that the affected diagrams must have been checked in at least once to be considered. The state of the public workspace is exported from checked out diagrams that have already been checked in once. In the preview and publication, you can only export the entire repository.
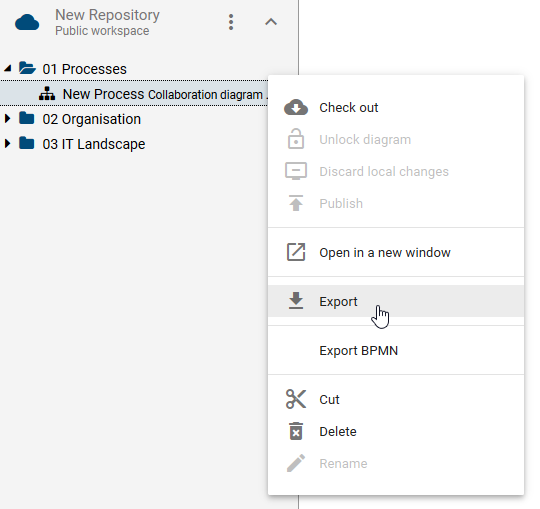
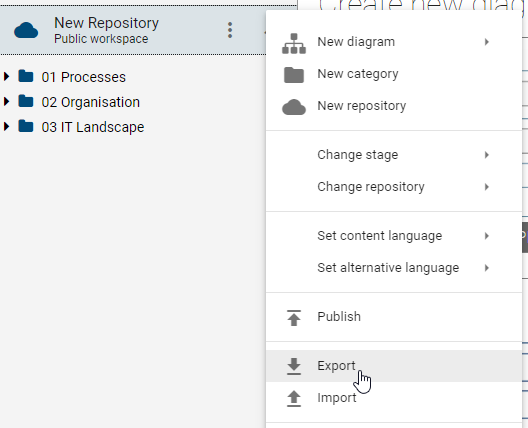
Diagram export: Open the context menu of the diagram that you want to export and click on the Export button. Now the export is created as ZIP-folder. It contains the selected diagram and attached files.
Category export: Open the context menu of the category you want to export and click on Export. Now the export is created as ZIP-folder. It contains the selected category, subcategories and included diagrams.
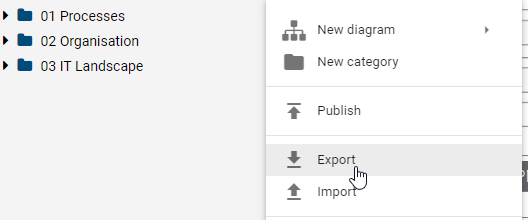
Repository export: Open the context menu of the repository that you want to export and click on Export. Now the export is created as ZIP-folder. This contains all categories, subcategories and diagrams contained in the repository.
The export can be downloaded by clicking on Download the export in the appearing toast.

You can import exported data.
Which exports are available?
The following different exports are available.
Manual: The manual report (.docx-document) can be executed on individual diagrams (BPMN and EPC) by default. The cover sheet contains the name of the diagram as well as some release dates. Furthermore, there is a process overview, a process graphic, an overview of the responsibilities in the process, a tabular representation of the process steps and a description of used resources. As standard the process overview contains responsible and consulted roles, inputs, outputs, IT systems as well as risks and KPIs. The tabular representation of the process steps includes a list of all existing activities and associated symbols such as inputs, outputs, systems, risks and KPIs.
Process matrix: Regarding the default settings, the process matrix (.xlsx file) can be executed on VCD, EPC, BPMN diagrams, on a category and on a repository. The file is divided into seven sheets. The first five sheets offer you pre-configured evaluations in form of pivot tables related to different entities. They offer evaluations about the “Application usage”, “Document usage”, “RACI mapping”, “Risk occurrence” and “Diagram metrics”. The “Data” sheet of the file contains some collected information. This includes some diagram information, all modeled activities and objects directly related to the activities, such as the so-called satellites. Among others, the Entity ID and the Occurrence ID, which uniquely identify the connected object and its occurrence in the diagram, are also listed here. Unconnected objects and objects that are connected to an activity via two corners, for example, controls of risks, are not taken into account. Furthermore, the report does not contain any information about the process flow. The last sheet “Matrix” includes a pivot table in which you can create various evaluations. For more information about how to handle pivot tables, see e.g. here or on this support website.
Best Practice
With the process matrix you can quickly identify which satellites are connected to which activities. For example, if an application runs out, you have an overview of the affected diagrams, the activities concerned and the other parties involved. For this purpose e.g., just activate the checkmarks for the PivotTable fields one at a time. You can then use Excel to filter the corresponding columns (for example, Object Type). You can also answer additional questions using the column fields and value fields of the pivot table.
Manual report with assignments: By default, this export can be executed on process overviews (VCD) and processes (EPC and BPMN), which contain subprocesses. It includes a comprehensive process description including all diagrams, which are shown behind the respective process and furthermore behind the stored diagrams.
Note
Subprocesses on start or end activities with the node symbol type NST_INTERFACE are explicitly excluded from the manual report with assignments.
Process warehouse: You have the option to access the export in the form of an .xlsx file with various categories and diagrams. When running the export on a category, all diagrams within that category are taken into account. The exported Excel file includes the worksheets “Diagram” and “Object”. In the worksheet “Diagram” all attributes of the involved diagrams, the diagram ID and the name of the category above are listed. The “Object” sheet contains the object type, the symbol type and all the attributes of the objects that are contained in the affected diagram. This also includes the Entity ID and the Occurrence ID, which uniquely identify the object and its occurrence in the diagram. Additionally, the affiliation to a diagram is shown for the respective objects using the diagram name and the diagram ID. Overall, all attributes in this export are output in the content language selected in the system.
Hint
Please note that the process warehouse export is not configurable by the administrator.
Hint
The date information you find within your exports (e.g., “Valid from”, “Valid to”, “Created date”, and similar) undergo conversion to the time zone of the currently active user. This ensures that the display of date information always aligns with the user’s current time zone.
Hint
In older versions, all attribute types were exported, regardless of whether they were deactivated or removed within the method. From now on, only visible attribute types are exported.
Note
Attribute values exceeding 32767 characters will be automatically shortened. A notification will be provided at the end of the shortened value indicating it has been reduced.
Note
In this export, all attribute types which use dates as values, will also have the data type date in the corresponding cell within the xlsx file. With this you can process these values easily, e.g. to calculate time spans. This applies for all Process warehouse exports, regardless of whether they are carried out for repositories, categories, diagrams or the catalog. The displayed date format in Excel (e.g. 12/05/2019 or 12:05.2019) depends on the display language, which has been set within the Windows language settings.
Tip
As part of the DSGVO action plan, you can filter the process warehouse for documents and activities to which “data protection” has been maintained. Another application possibility is filtering for “risk”, which allows you to see the risk matrix.
See “Creating reports” to know how to perform these exports.
Note
As an administrator, you can change the basic settings of individual reports, such as their availability. You can also customize the reports by using a report template.
Hint
Please note that running a matrix report on a BPMN diagram with no sequence flows or message flows (i.e., containing only activities, events, or gateways, but no connections) will result in an empty Excel file. When you open the file and enable editing, a warning message will appear. This is expected behavior because the pivot table in the matrix report represents relationships between diagram elements. However, without sequence or message flows, no relationships are defined.
Which reports sort activities based on the process flow?
Similar to the matrix diagram view activities are listed in certain reports according to the process flow of the diagram. This means that activities which are placed at the beginning of the process flow, will also be listed first in the corresponding report.
This sorting algorithm is available for all reports in .docx format. This effects by default the Manual and the Manual report with assignments. The affected diagram types are accordingly the collaboration diagram (BPMN), the process (EPC) and the process overview (VCD).
Note
When gateways or operators have been modeled in a process flow, then the probability of the activities will determine the order of those activities.
Process cost/ Simulation
The Process cost/Simulation (.xlsx file) can be executed on individual diagrams (BPMN and EPC). Downloading the report is described in detail in the Export Data section under “Creating reports”.
This report offers a detailed listing and calculation of different costs, times and capacity requirements on three worksheets. In principle, some attribute inputs are required in the affected diagrams of BIC Process Design for meaningful evaluation. These inputs affect not only the name of the resources and activities but also the attributes in the analysis attribute group. They are included in the report and explained below in the respective subsections under the point of view “taken from the system”. The imported values can be adjusted manually in the report itself. Furthermore, multiple occurrences of resource objects in a diagram are recognized as one object in the report. Occurrences of activities and activities or resources with the same name are output individually in the report. Note that different objects should generally have different names, otherwise some calculations may be corrupted. In the following, the individual worksheets are explained in more detail in order to clarify the analysis procedure.
Table sheet “Activities”
This spreadsheet contains four different blocks. In the following, the functions and calculations are illustrated by the individual terms within the blocks.
Process costs: This block is essential for the further, automatically executed calculations of all times and costs. The three required fields are not filled in automatically when the report is created. Instead, they must be entered manually in the Excel file.
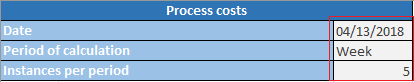
Date: In the corresponding cell, you can enter any date, for example, the current date.
Period of calculation: The entry of the calculation period is required in the corresponding cell. This could be “week” or “month”, for example. The period should be taken into account by entering values in BIC Process Design. Take care of consistency, so as not to distort some calculations. For example, the capacity of a resource (see worksheet “Resources”) depends on the selected period!
Instances per period: Depending on the calculation period, the number of runs of this process must be entered here, e.g. 5. Further calculations are only performed automatically using this number.
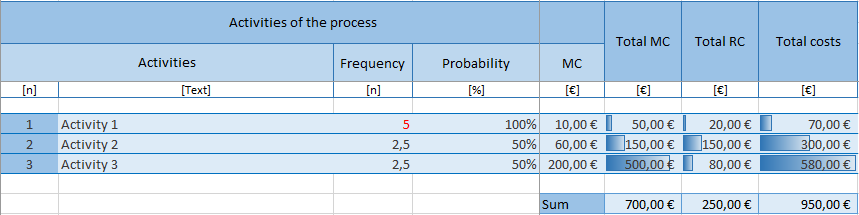
Activities of the process: This block offers a compact overview of the activities of the process, their frequencies and some total costs. These total costs partly originate the result of subsequent calculations.
Taken from the system:
Activities: Number assigned when reading the process and name of the activity
Probability: Probability with which this activity is performed in the process (in %)
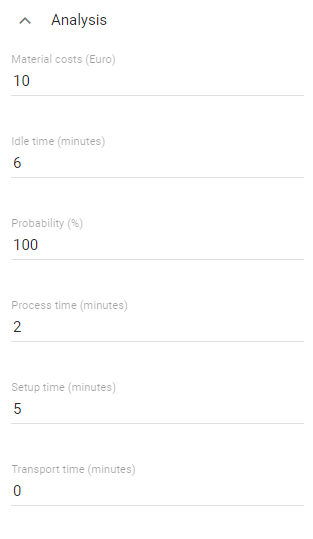
Material costs (MC): Cost of an activity (in €)
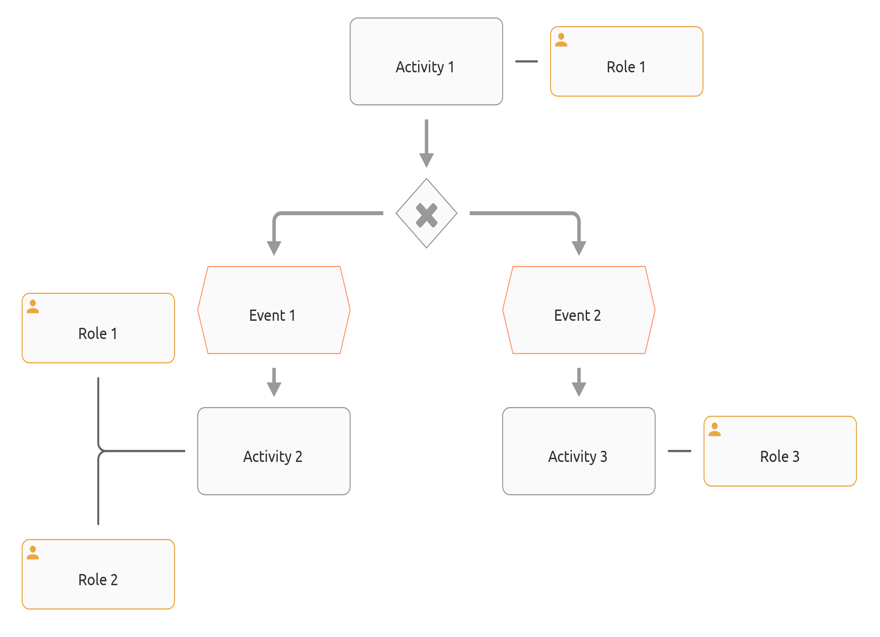
For example, the values for “Activity 1” have previously been entered in the attributes in the system as follows:
Calculations in the report depending on the instances per period:
Frequency: Probability multiplied by the number of runs; it indicates how often an activity is executed per period
Total material costs (Total MC): Material costs multiplied by the frequency; corresponds to the material costs of an activity per period (in €)
Total resource costs (Total RC): Sum of all costs of the resources involved in this activity per period (in €), calculated using the “Resources” block
Total costs: Sum of total resource costs and total material costs per activity per period (in €)
Sum: These three numbers each represent the sum of the Total MC, Total RC and Total Costs of all activities. They therefore correspond to the respective total costs of the period. (in €)
Times: In this block some basic and total times are listed.
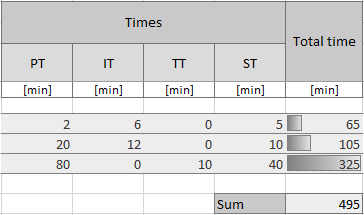
Taken from the system:
Process time (PT): Processing time of an activity (in minutes)
Idle time (IT): Idle time of an activity (in minutes)
Transport time (TT): Transport time of an activity (in minutes)
Setup time (ST): Setup time of an activity (in minutes)
For example, the values for “Activity 1” have previously been entered in the attributes in the system as follows:
Calculations in the report depending on the instances per period:
Total time: Sum of all times PT, IT, TT and ST multiplied by the frequency per activity (in minutes)
Sum: Sum of the total times of all activities per period (in minutes)
Resources: This block is subdivided into further resource blocks, which are lined up and each four columns long. For each resource, the name and the values listed below, such as associated costs and times, are displayed here. The involvement of a resource in an activity is indicated by the existing numbers within a block in the respective row. Accordingly, the fields remain empty if a resource does not execute an activity. The calculation for “Total RC” finally takes place across resources and thus stands in the last column of the block. The resources listed correspond to the ones in worksheet “Resources”. The worksheets are linked and influence each other.
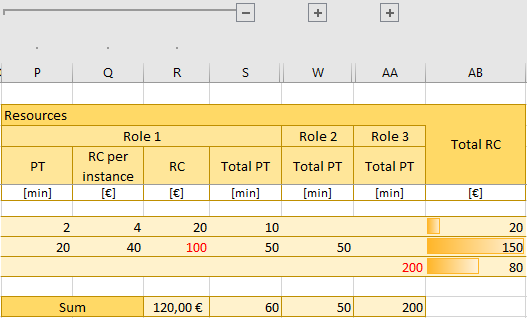
Taken from the system:
Process time (PT): Time taken by a resource to process an activity (in minutes). This corresponds to the PT of the activity if no separate entry per resource is possible in BIC Process Design. You can change the number yourself in the report.
Calculations in the report depending on the instances per period:
Resource costs per instance (RC per instance): Cost rate of the resource (see “Resources” sheet) multiplied by the PT that the resource requires to process an activity (in €). It indicates how much a resource would cost if the activity is run once.
Resource costs (RC): RC per instance multiplied by the frequency (in €). These are the costs per period that the resource causes by performing the activity.
Total process time (Total PC): Frequency multiplied by the PT that the resource needs to process an activity (in minutes). It specifies how much time the resource needs to complete the activity per period.
Sum: respective sum of RC, or PT. It indicates the total costs or total time the resource requires per activity per period (in € or minutes).
Total resource costs (Total RC): Sum of all RC per activity. It specifies the amount of costs of an activity per period, caused by the resources involved (in €).
Note
Input values transferred from the system, such as names, probabilities, costs, times and capacities, can be subsequently adjusted in the report as required. The changes are useful for analysis root-attributes “Capacity” and “Cost rate” of the “Role” object, for example, if these values are activity-specific. In contrast to occurrence attributes, root attributes are adopted for each occurrence of an object. Confirmed objects should therefore only be changed in the catalog or in the file itself.
Table sheet “Resources”
This section contains the resource requirement calculation, which shows the capacities and costs of individual resources separately.
Capacity requirements calculation: In this block, some values of resources are listed separately. These values correspond to the entries in the system, are calculated separately in the worksheet “Activities” or in this worksheet.
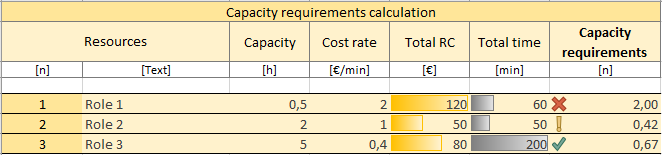
Taken from the system:
Resources: Number assigned when the process is read and name of the resources
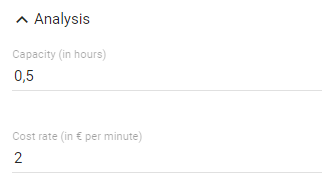
Capacity: Capacity of the resource (in hours)
Cost rate: Cost rate of the resource (in € per minute)
For example, the values for “Role 1” were previously entered in the attributes in the system as follows:
Calculations in the report depending on the instances per period:
Total resource costs (Total RC): Sum of the cost of this resource in the selected period (in €); it corresponds to “Sum” from worksheet “Activities”, block “Resources”
Total time: Sum of resource processing times over participating activities in the selected period (in minutes); it corresponds to “Sum” from worksheet “Activities”, block “Resources”
Capacity requirements: Ratio of the total time required by the resource to perform the activities of this process to its available capacity. The value of the capacity requirements therefore indicates the extent to which a resource uses its available time or whether more time is needed. A distinction is made as follows.
Value greater than 1 (red X): The time required for the tasks exceeds the capacity of this resource for the selected process. There is a capacity requirement.
Value between 0.5 and 1 (green check mark): The capacity is equal to or half the processing time required for the activities. The resource has sufficient capacity.
Value less than 0.5 (yellow exclamation point): The capacity is more than twice as large as the processing time required for the activities. The resource still has a lot of capacity.
Table sheet “Diagram”
Here you can see a picture of the evaluated diagram.
How can I import data?
Data exported from BIC Process Design or BIC Platform, such as diagrams, categories and repositories, can be imported in the public workspace of BIC Process Design. Published versions are not included in the import. Furthermore, this feature is available for users of the “Administrator” role.
Import into category: Open the context menu of the category in which you want to import data. Click on Import. In the opening window you can select and confirm the desired ZIP-folder. Then all categories and diagrams are inserted in the selected category.
Import into Repository: Open the context menu of the repository to which you want to import data. Click on Import. In the opening window you can select and confirm the desired ZIP-archive-folder. Then all categories and diagrams are inserted into the selected repository.
For the current import you will receive a note at the right bottom of the screen. You will also be notified of the successful completion of the import.

Hint
Please note that imports or uploads are technically limited to 1.000 MB in size.
Note
Please note that imported diagrams overwrite the contents of existing diagrams of the same ID. Depending on the import, the existing diagrams also change their position in the explorer. Deposits maintained in attributes, like subprocesses to other diagrams are adopted without any problems if the stored diagrams also exist in the target repository. Uploaded files, such as in the Attachment (URL) attribute, are also imported.
Note
The date information you find within your imports (e.g., “Valid from”, “Valid to”, “Created date”, and similar) undergo conversion to the time zone of the currently active user. This ensures that the display of date information always aligns with the user’s current time zone.
Entities and attached files included in the diagram and in the attributes are also imported. All catalog entries underneath are then compared with the catalog entries of the selected repository using the IDs. Existing data will be overwritten here.
Furthermore, the method of the system has to match the data of the import, there is no method-related validation.
Some examples to illustrate the functionality of the import:
You have exported a diagram for data backup. Later, the same diagram will be edited in BIC Process Design, so a new version will be available in the public workspace. The export thus contains an outdated state of the diagram. If this export is imported into the same repository, the new version of the diagram will be overwritten with the old one. Depending on the archive settings, you will not be able to access the new version after the import.
You want to import a diagram into “Category 1”. This diagram, that means the exact ID of the diagram you want to import, does already exist in “Category 2”. After the import, the diagram no longer stays in “Category 2”. Instead, the overwritten diagram is displayed in “Category 1”.
Note
Confirmed master data receive special attention during import. In addition to IDs, the attributes of the accepted (black), existing catalog entries of the target repository are also compared. If there are differences in at least one attribute, new, unconfirmed (red and italic font) catalog entries are created. These “duplicated” entries can then be merged by delete or reject.
How do I execute a BPMN export?
This export can be executed on Collaboration Diagrams (BPMN). The diagram is exported as a BPMN standard (XML format) and is thus available for other systems or here as BPMN Import.
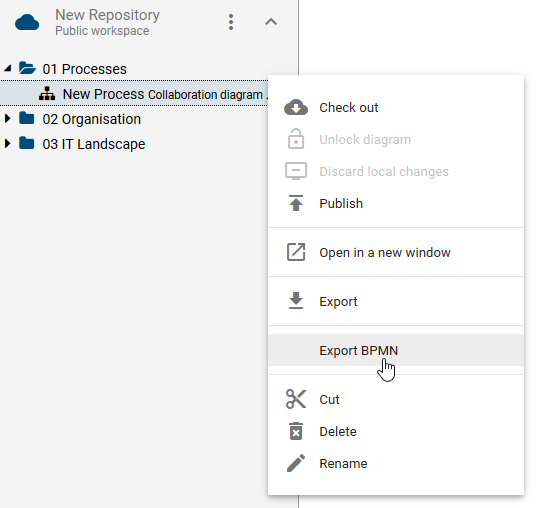
Navigate to the BPMN diagram you want to export. Open the context menu of this diagram and select the option Export BPMN.
At the bottom right of the screen, you will receive information about the start and the completion of the export. Click on the link to Download the export.
Note
Please note that formatting of e.g. font color, font size, fillings ect. in not part of the export function and will be lost during the export.
Warning
BIC offers the flexibility to extend the modeling notation beyond BPMN standards, allowing you to incorporate concepts such as customer journey mapping to enhance your process representation. However, it is important to note that the BPMN export functionality might not be supported when these extensions or custom extensions are utilized.
How do I execute a BPMN import?
Individual diagrams in BPMN DI XML format, the “BPMN Diagram Interchange Extensible Markup Language Format”, and ZIP files, that contain these diagrams, can be imported into the public workspace of BIC Process Design. The BPMN import is also supported by the BPMN export.
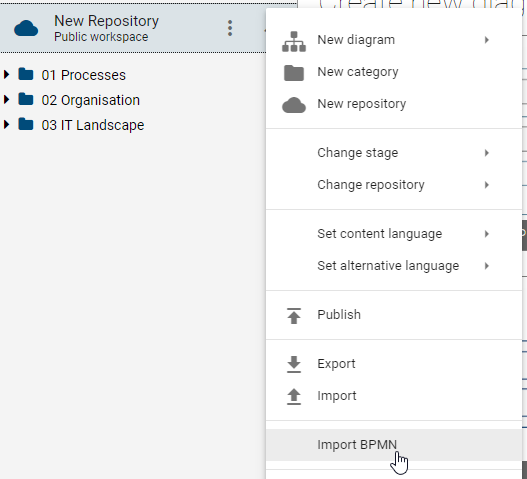
Navigate to the targeted repository for importing. Open the context menu of the repository or the category and select the option Import BPMN.
Choose the intended BPMN file or ZIP file in the appearing file selection window and select Open in order to start the import. The diagram is then imported into the repository or the selected category. If you have chosen a ZIP file, the diagrams contained therein are imported accordingly. Folder structures are also taken into account, that means a subcategory with the corresponding diagrams is created for each folder contained in the ZIP file.
Vertical pools are supported during the import if they are defined in the method. Please note, that collapsed subprocesses and pools are not supported by BIC Process Design. If you import a BPMN diagram with collapsed subprocesses or pools from another platform, the collapsed content is not imported into BIC Process Design. Instead, they are presented as an empty activity or empty pool. To import the contents of the subprocesses and pools, repeat the export in the source platform with expanded subprocesses and pools. Then the underlying content is taken into account during import and displayed in the diagram. Please also note that formatting of e.g. font color, font size, fillings ect. in not part of the import function and will not be included.
No catalog entries are created during the import, regardless of the administration settings of the catalog. This applies, for example, to pools and lanes and objects, such as documents, contained therein. Therefore, the objects must be manually referenced to the corresponding catalog entry using the suggestion list or can be added as a new suggestion in order to have them available in the catalog.
Note
For example, if you have exported the import file from Signavio before, catalog entries will be identified and created as suggestions in the catalog. The reuse of catalog entries is also taken into account so that no duplicates are created. Furthermore, the use of resources, such as roles and applications, is supported. These are therefore not displayed as annotations.
How can I share a diagram from the public workspace?
With the permissions of the user role “Author”, you can share the diagram version in the public workspace, if it exists, with users of all roles. For example, you can get feedback about the modeling of this diagram from users of the “Reader” role who otherwise have no access to this workspace.
To do this, navigate to the affected diagram and open the version tab. Select Share by email from the public workspace field.

This will open a new email in your email program. It contains the link to the diagram and shows the diagram name in the subject line. The user who receives the email can then view and comment the diagram in the public workspace.
Warning
Please note that the shared URL is stable: If you provide a user access to a diagram using this share function, it is not revocable. The user will always be able to view the unpublished version of the diagram. You can only suppress the access by maintaining the attribute “Restricted access”.
How can I share a catalog entry from the public workspace?
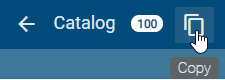
If you are in the catalog in public workspace, you can simply copy the catalog URL to the clipboard to forward it. To do this, click on the Copy button in the menu bar. At the bottom right of the screen you will see a toast stating that the URL has been copied successfully. You can share this link to any user of the application, for example to allow a reader to view the current modeling state of a certain catalog entry.
Warning
Please note that the shared URL is stable. If you provide a user access to a catalog item by sharing the URL, it is not revocable. The user will always be able to view the unpublished version of the diagram. You can only suppress the access by maintaining the attribute “Restricted access”.