Diagram views
Which alternative views on diagrams are available?
In addition to the diagram view, you can view the matrix and the process execution. The RACI matrix and process execution are available in the Public workspace, the Preview, and in the Publication. Both views are limited to the diagram types BPMN and EPC. The matrix also exists for VCD process overviews.
Note
Please note that the different views for diagrams are not available in edit mode.
Diagram
To display the Diagram, proceed as follows:
This view is initially set. It presents the diagram or the modeling. Depending on the workspace, you can, for example, edit the diagram or check it out. The graphical representation of the diagrams differs by the diagram versions for the editor (local and public workspace) and the preview and publication stages, which give modelers additional operation functions.
If the diagram view is not opened, you can display it by clicking on Diagram in the menu bar.
Matrix
To display the Matrix, follow these steps:
Select an VCD, EPC or BPMN diagram in the repository for which you want to view the RACI Matrix. Click the Matrix-button in the menu bar.
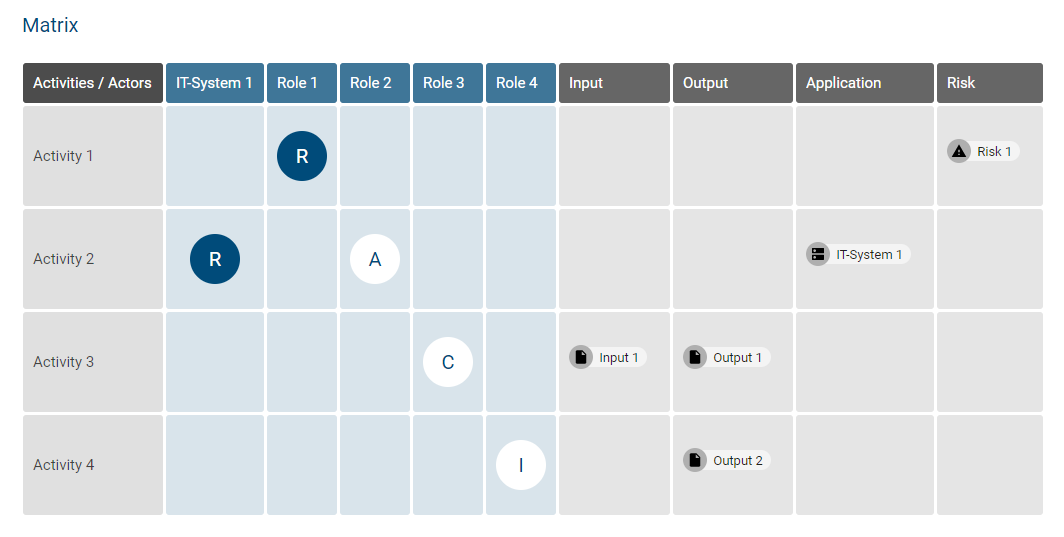
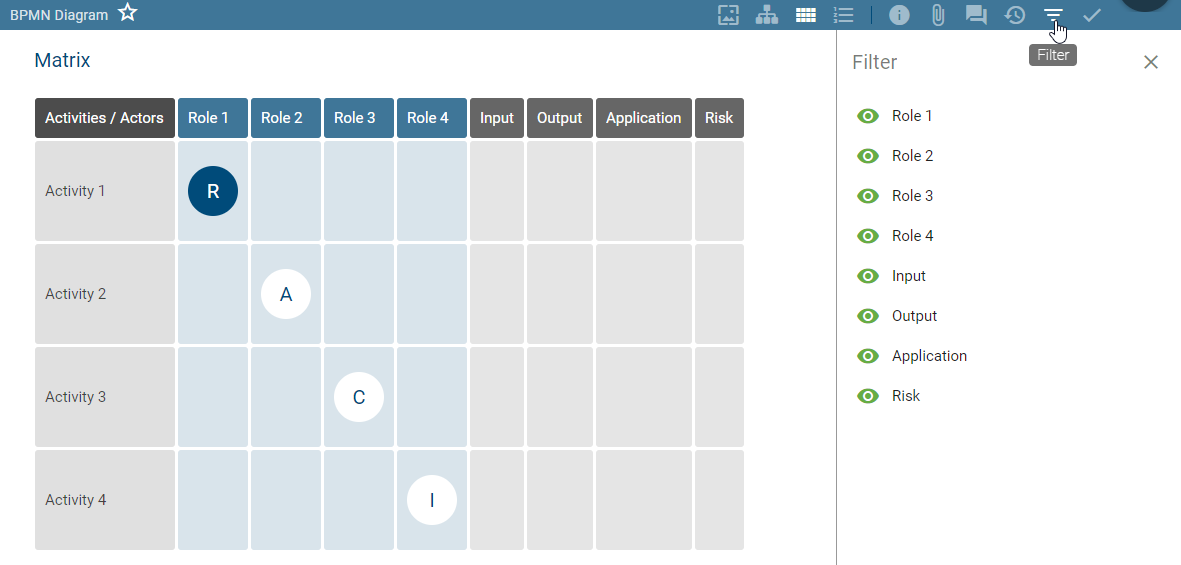
Depending on the process flow, the matrix displays all the activities of a diagram in rows. All actors, such as roles and responsible applications (e.g. pools), form the columns in alphabetical order. In the matrix cells, the association type between the activity and the resource is displayed (R-Responsible, I-Informed, C-Consulted, A-Accountable). The following columns are about inputs, outputs, applications and risks of the diagram. You can see an alphabetical list of the objects, that are associated with an activity, in each cell. Click on an entry to display its details. If the entry has an attachment, you can see a paperclip icon in the chip. By clicking on this paperclip, attachments can be accessed directly. See the profile for a more detailed description.
Click on the Diagram-button to return to the diagram view.
Process execution
To display the Process Execution, follow these steps:
Select an EPC or BPMN diagram in the repository for which you want to view the “To Do”-List. Click the Process execution-button in the menu bar.
Based on your modeling in the Diagram view, you can now see the process execution in the middle of your screen. The activities, decisions and related events are listed here.
The activities represent the individual tasks in the process. Below each activity name, the responsible resource is displayed if it has been modeled in the diagram. When you select an activity, the attribute view on the right-hand side provides more information about this task.
The process flow means the sequence of activities and is initially determined by the software for the user. The decisions corresponding to the gateways in the diagram are made based on the probability of the process flow. The most probable process flow is automatically displayed. You can maintain the Probability for each activity in its attributes. If no probability has been maintained, the position of the node is decisive instead. Loops are not considered for automatic decisions. Overall, only the sequence flow forms the basis for the path.
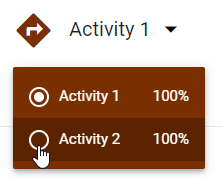
The process flow is thus divided by the decisions into segments or sections, in which successive activities are placed. The activities are consecutively numbered starting with 1. The segments displayed depend on the decisions made. Each segment has its own background color for the activity numbers. The respective segment can also be identified by its heading, which includes the name of the gateway and the sequence of the selected path in the process. If a gateway was not named there, only the name of the sequence is displayed. If the sequence also has no name, the heading corresponds to the name of the subsequent activity. In front of the heading you can always see the route icon belonging to the segment and you can make a decision yourself that has an impact on the subsequent tasks. The icon therefore signals a gateway in the process flow, whereby a distinction is made between the following gateways:
Exclusive or: By clicking on the route icon, a menu shows you the possible decisions. Here you can just select one alternative, which adjusts the list of subsequent activities. The section of an “Or” decision ends with the last activity before the next gateway or the end of the process. The background color of the numbering does not change within this segment.
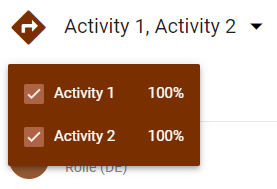
Inclusive or: In this case, one route of the process is listed initially. With a click on the route icon you can select another route or several routes at the same time. A path then corresponds to a subsegment. Within this segment, each subsegment has the same background color of the numbering in different transparency levels.
Parallel: In the case of an “And” gateway, all parallel paths of the process are listed one below the other, since all paths are executed. A path corresponds to a subsegment. Within this segment, each subsegment has the same background color of numbering in different levels of transparency. The numbering is continuous across all segments and subsegments. Nevertheless, a decision can be made here by clicking on the route icon to highlight individual segments.
Note
Multiple starting points for the path are also displayed as an exclusive gateway above all activities.
Overall, the numbering is continuous across all segments and subsegments. The end of the process flow is marked by the corresponding event and by a flag instead of the numbering. If there is no end event but an activity, the end of the process is inserted virtually and named accordingly, as shown below.

Click on the Diagram-button to return to the diagram view. Further options to work with the process execution are described in the following chapter.
How can I perform process execution tasks?
To obtain an overview of the progress of a running process instance, you can mark the individual activities as completed in the process execution. This is only visible to you.
Navigate to the Process execution of the desired BPMN or EPC diagram. There you can see the activities to be executed and make decisions at gateways. For a detailed description please refer to the associated chapter.
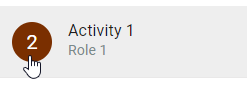
If you have completed a task, you can mark it by clicking on the number in the corresponding activity. There you will then see a check mark for the status “Done”.

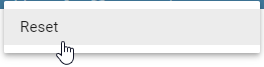
The tasks can be marked as completed in any order. To reset the status of the tasks, for example, after a complete run of the process, navigate to the context menu More Options and choose Reset.
In addition, when a decision is changed in the process, the status of all subsequent and possibly already completed tasks is reset.
Tip
For an optimal work with process execution and extensive functionalities in dealing with process instances we refer to our product BIC Process Execution! You can find the corresponding documentation here.
How can I filter the RACI matrix?
Open the RACI matrix of an EPC or BPMN diagram. You can display the filter in the right sidebar by clicking on Filter in the menu bar. There, all columns of the matrix are listed as filter options. This includes actors, such as roles and applications. The filters are initially activated.
Click on one or more “eye” symbols to hide the corresponding columns of the matrix. Only activities or rows that are not related to the filtered column, are displayed. The hidden entries are grayed out in the filter tab and the icon is crossed out.
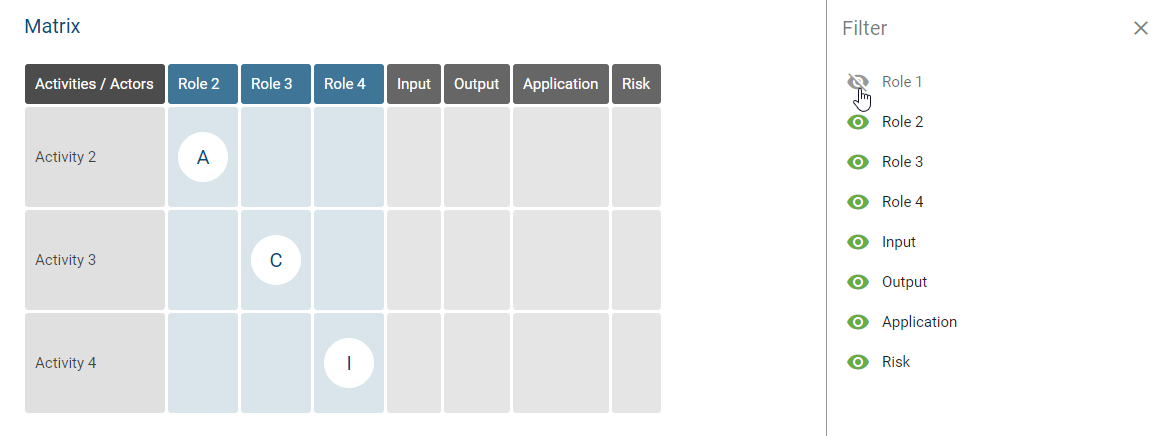
Similarly, you can remove the filters to display the entire matrix. Activities that are not related to an actor are now displayed again.
How can I hide entities in the diagram?
In the diagram view, you can open the Filter bar via the menu bar.

In the sidebar, all symbol types that are modeled in the open diagram are listed in alphabetical order. Initially, each list entry is selected, which implies that modeled objects of all object types are visible.
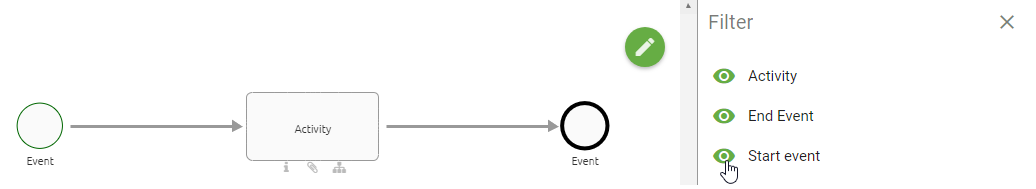
To hide a specific symbol type and its connections to other entities (or display it transparently), click on the corresponding entry in the list. The entry is then grayed out and the “eye” icon is crossed out.

Similarly, you can also hide or show several symbol types at the same time with another click.
After closing the filter bar, all symbols are automatically displayed. As long as you have opened the diagram, the filter selection remains. Therefore, the previously made selection becomes active again when the filter bar is opened again without changing the diagram.
Note the difference between symbol types and object types. This becomes clear, for example, in activities in process overviews (VCD). Two activities can represent different symbol types, such as “Value chain” and “Value chain start”. In addition, a pool in BPMN diagrams is not available as a filter.
Note
For a high-performance modeling with an open filter bar, changed filter options are taken over when saving.